EXECUTIVE SUMMARY
The market for food and beverages service business is expected to expand by some 4.0-5.0% annually over 2024-2026 to a total value of THB 275.0-300.0 billion. Demand will benefit from:
(i) gradual economic recovery over 2025 and 2026; (ii) the increasing number of international tourists, especially from the major markets of China, Malaysia, and South Korea, while the number of domestic trips is also forecast to rise, particularly in light of ongoing government measures to stimulate demand further; and (iii) consumer behavior has shifted towards dining out more frequently, especially after the easing of COVID-19. This trend is also driven by urbanization and the influence of social media, which introduces new restaurants and special offers. On the supply side, growth will come from: (i) a more efficient logistics system, such as Cold Chain Logistics, has resulted in prolonged food quality preservation. This development facilitates the opening of restaurants in areas far from sources of ingredients; (ii) the increasing use of food delivery apps equipped with new features that are better able to respond to changing consumer behavior and that thus help restaurants connect more easily with potential customers; and (iii) growth in both large and small retail sites in and around Bangkok and in the provinces, which will then help to attract new food-related businesses to these areas.
Krungsri Research view
-
Food and beverages service businesses (major players/ chains): The business environment will improve on: (i) better conditions for the tourism industry and the economy overall; (ii) an expansion in the extent of branch networks in response to rising tourist numbers and intensifying economic activity; (iii) ongoing brand loyalty and ease of access to branch outlets; and (iv) the bargaining power of businesses towards suppliers due to large volumes of raw material orders allows for a reduction in unit costs of products, particularly during periods of high prices for food and beverage raw materials. Overall, large players are therefore significantly better placed to generate profits.
-
Food and beverages service (smaller/independent operations): Overall, the market will grow in step with rising tourist numbers and a strengthening economy. However, players will have to contend with the high cost of inputs and the steady entry into the market of large corporations operating extensive branch networks, which will then undercut players’ competitiveness. Furthermore, consumer purchasing power may remain constrained by the persistently high cost of living. This causes these businesses, the majority of which are still small and medium-sized businesses, to face risks concerning their ability to be profitable.
Overview
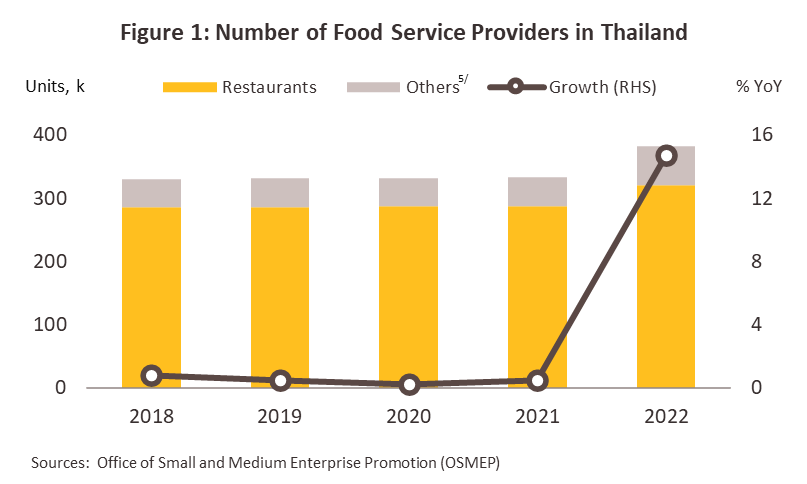
Businesses classed as ‘food and beverage service activities’ include companies selling food, drinks, ice cream, and cake, whether these are full service, limited service1/, or takeaway businesses. As of 2022, there were 382,083 food and beverage service establishments registered in the official database system2/, up 14.7% from 2021’s total of 332,976 (Figure 1). As per the Thailand Standard Industrial Classification (TSIC), these fall into 7 major groups3/. The official definitions of these are given below:
1) Restaurants4/: These provide prepared food and drinks to customers to eat in or take away, often together with other supporting services, such as providing seating to customers and organizing table- or self-service facilities. This group thus includes standard restaurants, cafés, counter service restaurants, etc. There are 321,096 registered service establishments of this type, and these thus account for 84.0% of food and beverage service industries.
2) Non-alcoholic beverage stores5/: These businesses sell alcohol-free drinks to the public for immediate consumption, though these may also provide additional services such as entertainment, seating facilities, table- or self-service, and takeaway sales. Examples include cafés and shops selling fruit juices. There are 56,951 registered service establishments of this type (14.9% of the total).
3) Alcoholic beverage stores5/: These businesses sell alcoholic drinks to the public for immediate consumption, though these may also provide additional services such as entertainment, seating facilities, table- or self-service, and takeaway sales. Examples include bars and pubs. Nationally, there are 3,885 registered service establishments of this type (1.0% of the total).
4) Foods stalls and market sellers5/: This covers the sale of ready-to-consume food and drinks from stalls or sellers in markets. Sellers may or may not provide additional services such as entertainment or seating. There are only 73 registered service establishments of this type (less than 0.1% of the total).
5) Mobile food businesses5/: This category describes businesses selling ready-to-consume food and drink from mobile premises, including hand-pulled carts, or pedal- or motor-powered vehicles. There are only 57 registered service establishments of this type (less than 0.1% of the total).
6) Mobile beverage businesses5/: This category describes businesses selling ready-to-consume drink from mobile premises, including hand-pulled carts, or pedal- or motor-powered vehicles. There are only 12 registered service establishments of this type (less than 0.1% of the total).
7) Beverage stalls and market sellers5/: This group includes businesses selling ready-to-consume drink from stalls or in markets. Sellers may or may not provide additional services such as entertainment or seating. There are only 9 registered service establishments of this type (less than 0.1% of the total).
The number of service establishments in categories 4-7 is small as the database covers only those registered with the Office of Small and Medium Enterprises Promotion (OSMEP) and the Department of Business Development. Most service providers in these categories are micro-SMEs operating informally without registration.
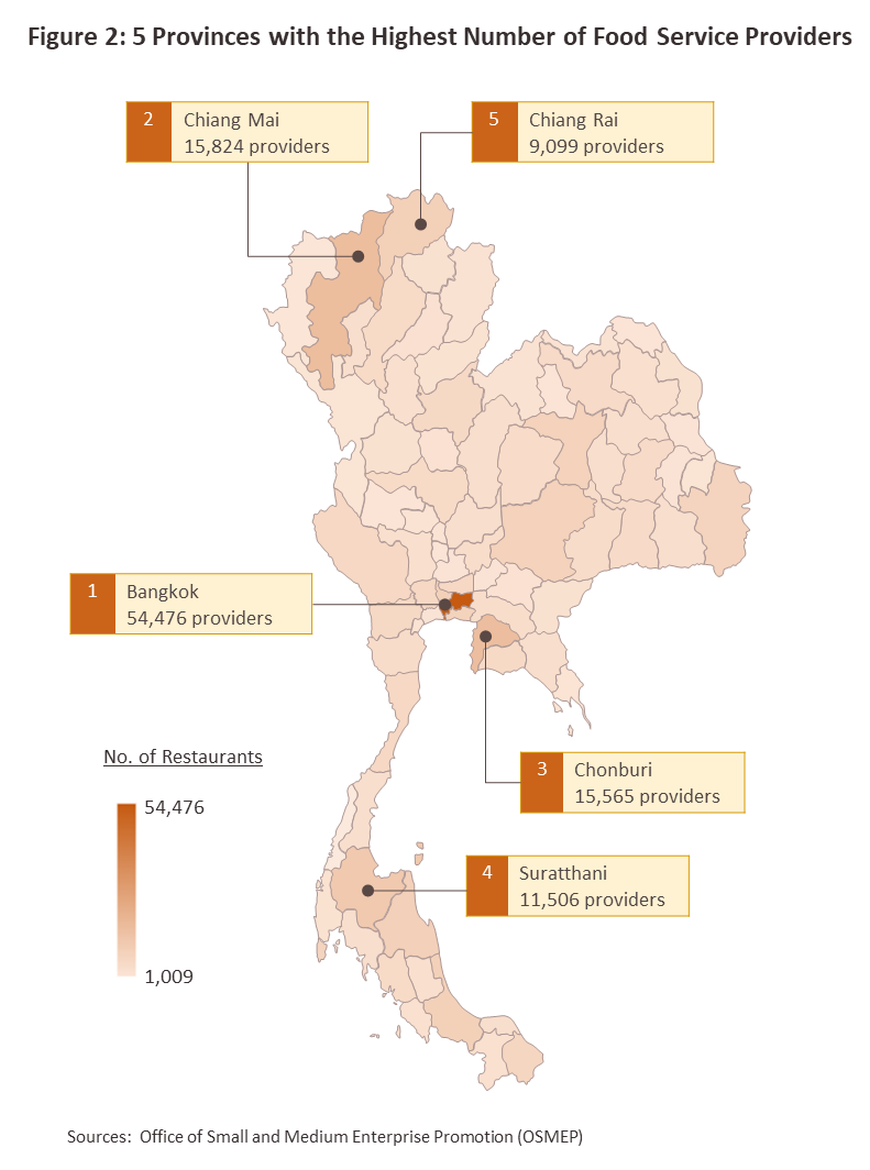
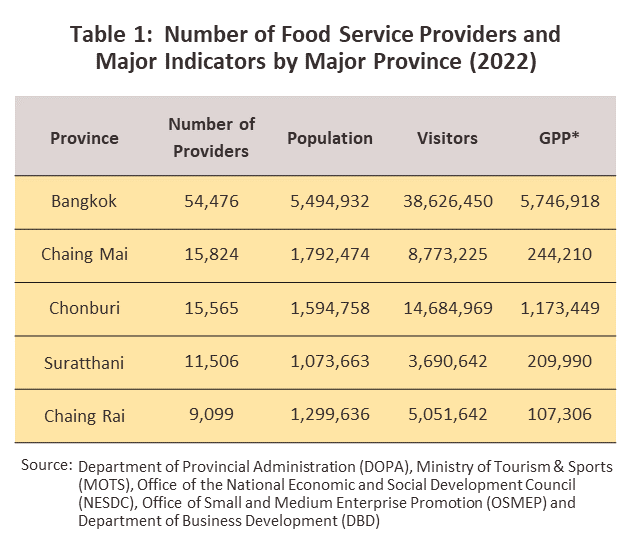
The greatest geographic concentration of players in the food and beverages service industry is in Bangkok, which thanks to its status as the country’s capital, a major global tourist attraction, and the center of the nation’s economic activity, is home to 54,476 restaurants and related businesses, or 14.3% of the total. Bangkok is followed in importance by Chiang Mai with 15,824 food service providers (4.1% of the total), Chonburi with 15,565 providers (4.1%), Surat Thani with 11,506 providers (3.0%), and Chiang Rai with 9,099 providers (2.4%) (Figure 2). It is notable that the majority of these provinces are densely populated and attract significant numbers of both Thai and overseas tourists. Broadly speaking, the industry falls under the oversight of the Ministry of Public Health, which is responsible for ensuring that restaurants meet set standards concerning personnel, on-site hygiene, equipment, and packaging.
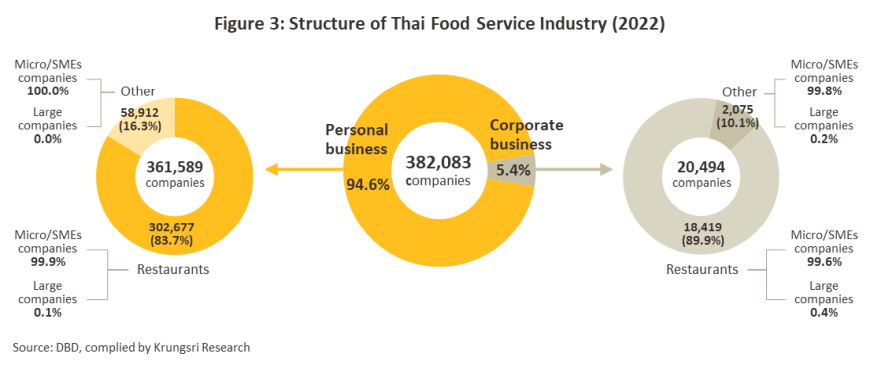
The industry is split into two major groupings, and data from 2022 indicate that these had the following characteristics (Figure 3):
-
Personal businesses/sole proprietorship: 94.6% of the industry, or 361,589 businesses, fell into this category. 99.9% of these (361,586 companies) counted as micro, small, or medium-sized enterprises and just 3 were large undertakings.
-
Registered/incorporated businesses: The remaining 5.4% (or 20,494 companies) were formally incorporated as registered companies. Again, the vast majority (20,423 businesses or 99.7% of the total) were micro, small, or medium-sized enterprises, though in this case, 71 were large undertakings.
Considering only restaurants, the most represented category by far, 94.3%, or 302,677 operations, were run as personal businesses. This high percentage is partly explained by the fact that restaurants meet a basic human need and partly by the fact that the capital costs involved in setting up in business are very variable and depend largely on the consumer segment being targeted. The barriers to market entry, therefore, may be very low. The remaining 18,419 operations (5.7%) are thus formally registered corporations. The business environment is strongly influenced by the state of the economy and the outlook for the tourism sector, as well as by growth in the number of restaurants sited in department stores and modern trade outlets.
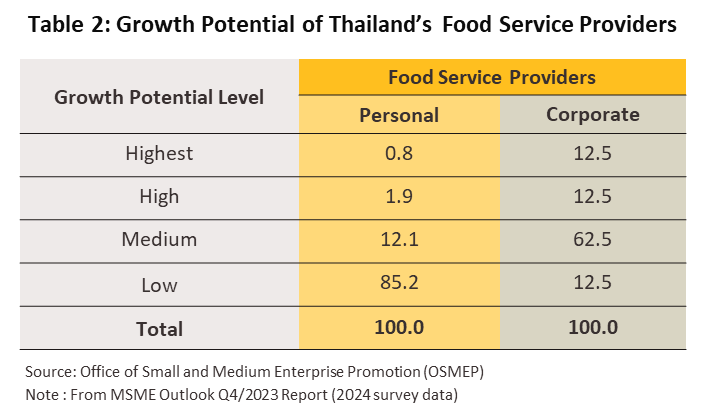
Although the majority of restaurants are run as personal businesses, their growth potential is significantly below that of corporate businesses6/. Data from the Office of Small and Medium Enterprise Promotion thus shows that although 87.5% of the latter have mid to high growth potential, for personal businesses, this potential is just 14.8% (Table 2).
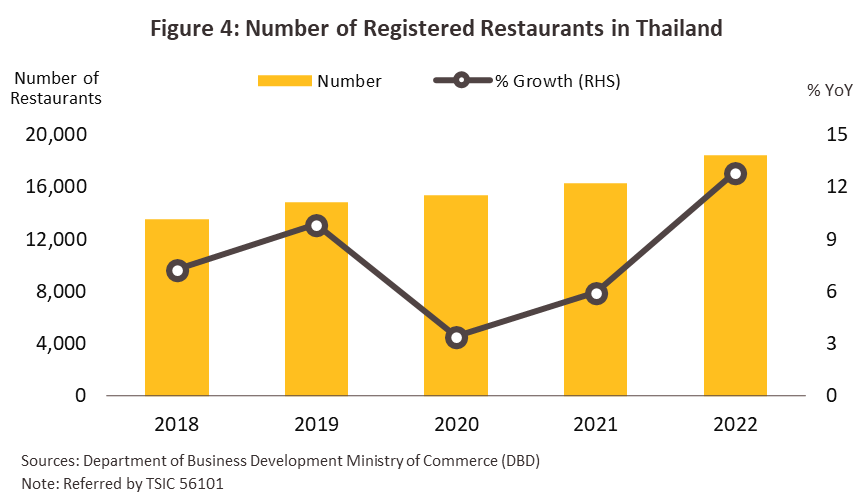
According from data from the Department of Business Development shows that in 2022, there were 20,494 corporations operating in the food and beverages service industry, up 14.0% from 2021’s total of 17,982. The 2022 figure included 18,419 restaurants (89.9% of the total), which was also up 12.9% from the 2021 total of 16,319 restaurants (Figure 4). The industry was boosted by the reopening of the country and the return of economic life to normal, which then encouraged consumers to begin eating out, traveling, socializing and engaging in other activities outside the home, with positive knock-on effects for restaurants. Nevertheless, the entry of new players to the market has added to competitive pressures. In 2022, 649 restaurants ended operations, a 4.5% rise from the 621 closures recorded in 2021.
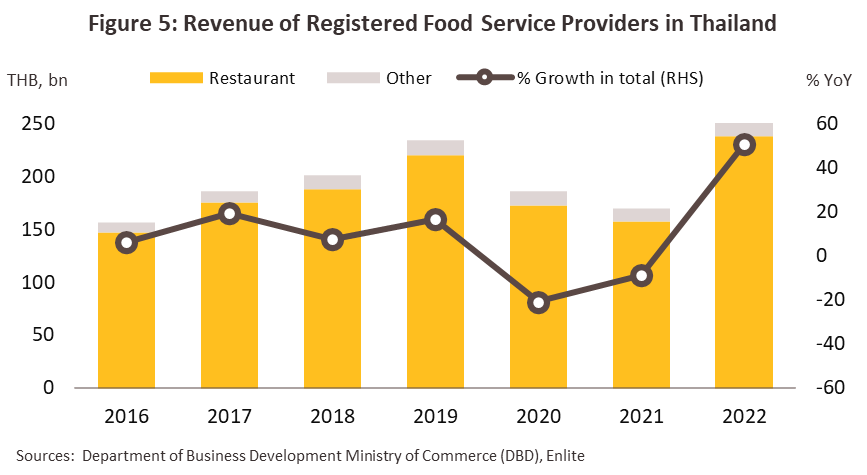
Overall income for restaurants and related businesses registered with the Department of Business Development came to THB 255.6 billion in 20227/, a jump of 50.7% from 2021’s THB 169.6 billion (Figure 5). The market can be split into the following two categories.
-
Restaurants: These generated receipts worth THB 237.8 billion in 2022, a full 93.1% of industry income. Over the longer term, restaurant income has grown by 7.9% per year8/. After economic activities returned to normal, the income of restaurant business operators grew by 51.3% in 2022, rebounding from consecutive contractions in the previous two years due to the impact of COVID-19. (Figure 5).
-
Almost all income to the industry came from domestically owned restaurants, which generated THB 234.8 billion in income (98.7% of all income to restaurants). This was thus a rise of 51.2% from the THB 155.2 billion received in 2021. By contrast, foreign owned restaurants accounted for 1.3% of the total, or THB 3.1 billion, up 55.0% from 2021’s THB 2.0 billion.
-
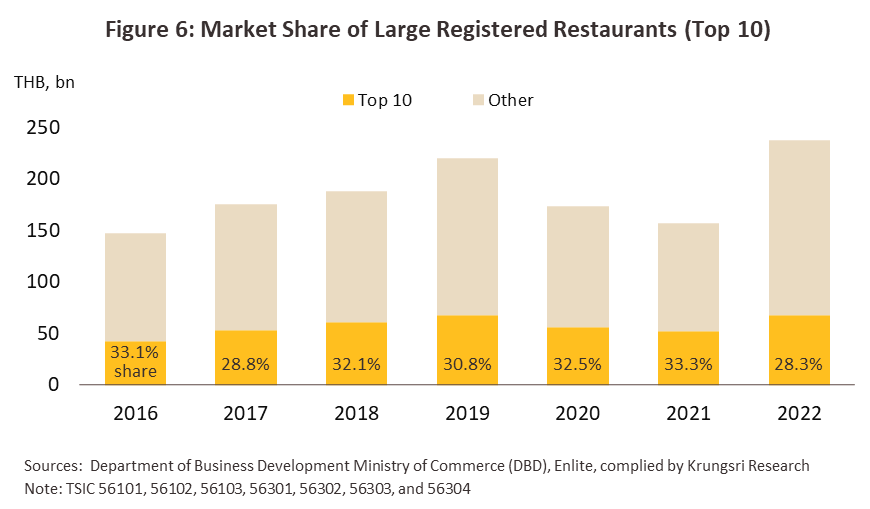
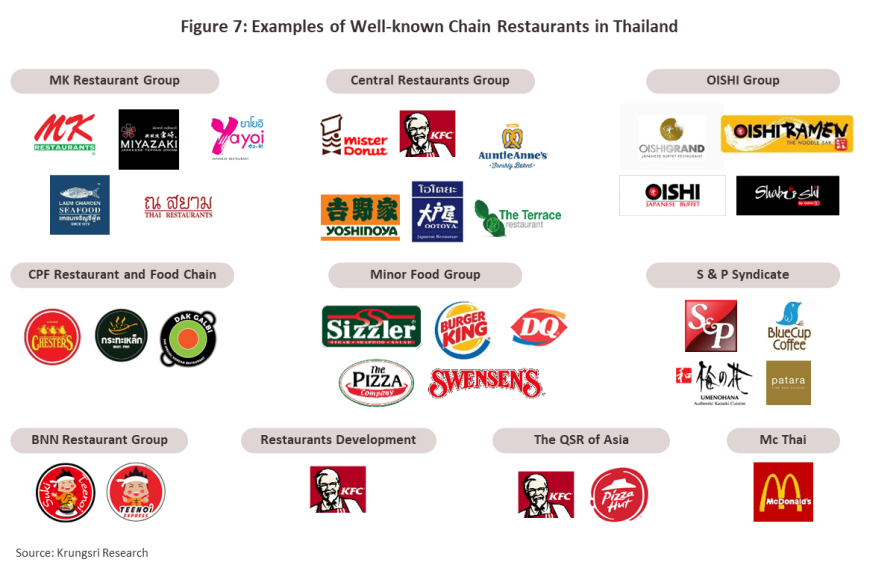
Data from the Department of Business Development shows that the 10 most important players in the industry are: MK Restaurant Group Co., Ltd., Central Restaurants Group Co., Ltd., The QSR of Asia Co., Ltd., CPF Restaurant and Food Chain Co., Ltd., Mc Thai Co., Ltd., S&P Syndicate Co., Ltd., Restaurants Development Co., Ltd., The Minor Food Group PCL., Oishi Group PCL., and BNN Restaurant Group Co.,Ltd. These ten corporations operate extensive restaurant chains9/ and in 2022, these were the source of 28.3% of total restaurant revenue, or THB 67.2 billion. Over recent years, revenue has grown at an average rate of 5.5% per year10/ (figures 6 and 7).
-
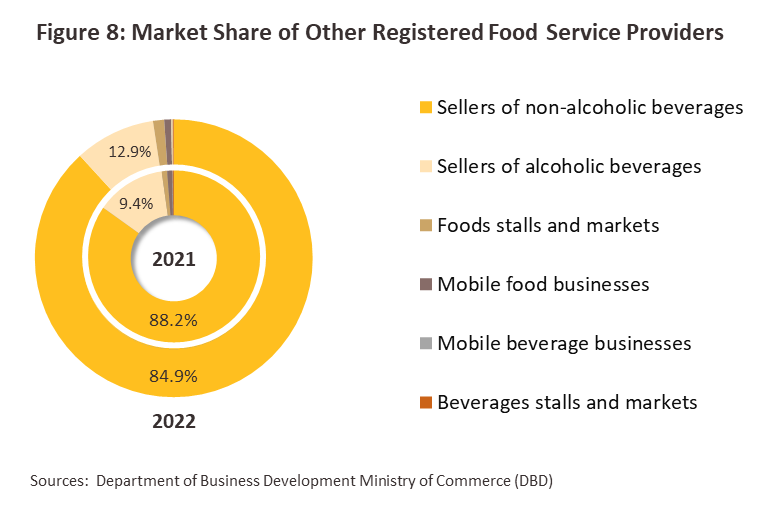
Other businesses: These accounted for just 7.0% of industry revenue in 2022, or THB 17.8 billion, though this rose by 12.6% annually11/. Having slumped through the pandemic, the return of economic and social life to normal in 2022 allowed receipts to bounce back to growth of 42.8%. This segment is comprised of the following sub-groups (Figure 8).
1) Sellers of non-alcoholic beverages (e.g., cafés): Revenue rose 37.4% from THB 11.0 billion in 2021 to THB 15.1 billion in 2022. This segment thus took 84.9% of all revenue going to ‘other’ businesses, down slightly from 2021’s 88.2%.
2) Sellers of alcoholic beverages (e.g., pubs, bars, etc.): Revenue surged 94.8%, thus climbing from THB 1.2 billion to THB 2.3 billion. The share of total revenue going to this segment also expanded from 9.4% of the total in 2021 to 12.9% a year later.
3) Foods stalls and market sellers: With revenue of THB 180.3 million (up 16.0% from 2021’s THB 155.4 million), these represented 1.0% of total ‘other’ revenue (down from 1.3% in 2021).
4) Mobile food businesses: Revenue rose 75.9% from THB 95.5 million to THB 168.0 million, and so in 2022, mobile food sellers accounted for 0.9% of ‘other’ revenue (up from 0.8% in 2021).
5) Mobile beverage businesses: 2022 revenue totaled THB 26.7 million, up 77.6% from 2021’s THB 15.0 million. As a share of ‘other’ revenue, this also rose from 0.1% to 0.2%.
6) Beverage stalls and market sellers: Revenue rose at the relatively slow rate of 7.9%, taking total receipts from THB 22.3 million to THB 24.1 million. The contribution of this segment to ‘other’ revenue fell from 0.2% to 0.1%.
-
99.4% of all revenue in the ‘other’ category, or THB 17.7 billion, was generated by Thai businesses, up 42.7% from the THB 12.4 billion recorded in 2021. By contrast, foreign-owned businesses received just THB 16.0 million, though this was up 247.8% from 2021’s THB 4.6 million.
-
Data collected by the Department of Business Development show that the most important players in the ‘other’ segment are: Coffee Concepts Retail Co.,Ltd., Tiptari Ltd., S.C.Group. Co,Ltd., Dao Coffee Beans Co,Ltd., and TAISUMPOA 2003 Co.,Ltd. These four companies were responsible for THB 10.4 billion in receipts, or 58.4% of all revenue to the segment. revenue has been rising by an average of 9.7% annually11/.
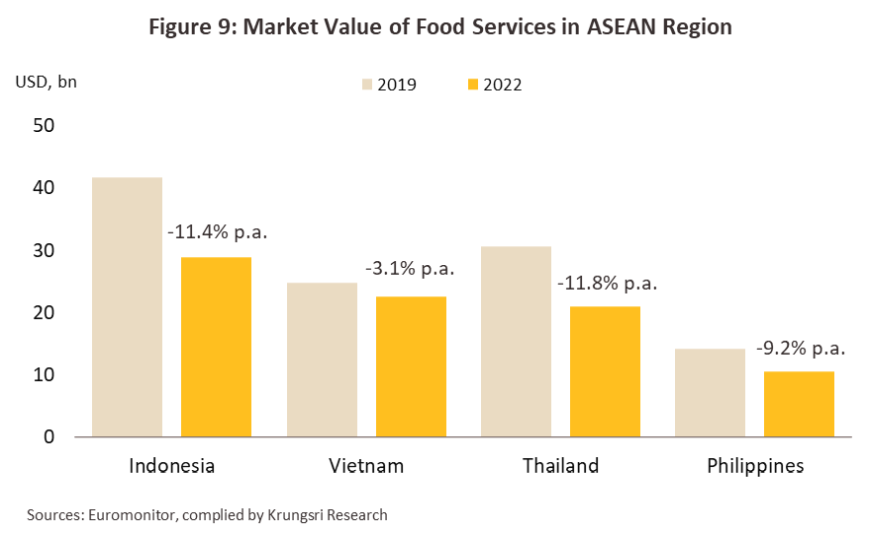
Thai food and beverage service activities encompass a wide range of operations with regard to their size, their location, and the nature of their business operations. The industry suffered over 2019-2022 with the spread of Covid-19 and because its fortunes are highly dependent on both overall economic conditions and the state of the tourist industry, it is not surprising that as tourist numbers crashed through this period, income contracted -11.8% CAGR (Figure 9). However, the easing of the pandemic, the relaxation of government controls on travel, and the reopening of the country all helped to boost sales. Thus, with domestic tourism increasing by 135.9% from 53 million trips to 125.0 million trips and foreign arrivals exploding 2,788.9% (up from 0.4 million to 10.4 million tourists), the contribution of accommodation and food service activities to GDP rose from 3.3% in 2021 to 4.6% in 2022 (Figure 10). Nevertheless, at USD 21.0 billion, the total value of Thai food and beverage services remains rather limited compared to some of the country’s regional peers, including Indonesia (USD 29.0 billion) and Vietnam (USD 22.6 billion).

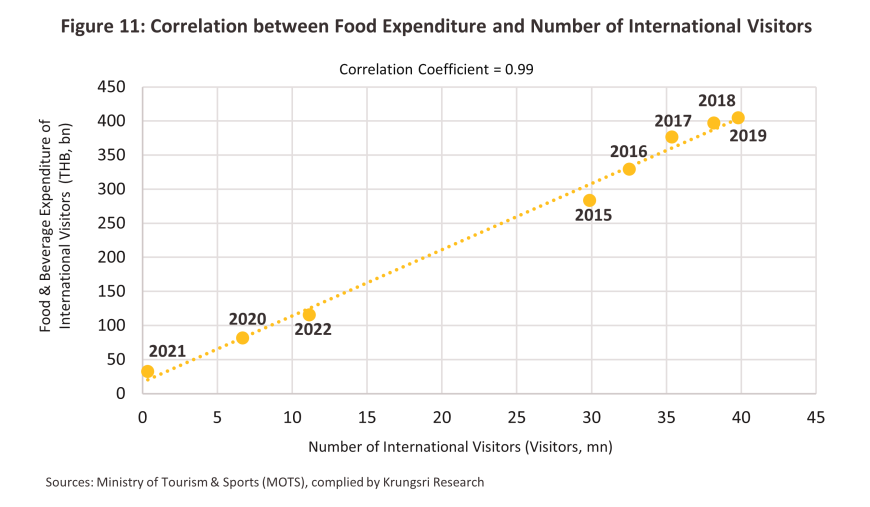
Considering of the relationship between domestic spending on food and drink and tourist arrivals over 2015 to 2022 shows that these have a high correlation coefficient of 0.99 (Figure 11), indicating that there is a very tight connection between rising foreign tourist numbers and growth in expenditure of foreign tourists on food and beverages. This supports the growth in the overall food and beverage service business. Over this period, spending by foreign tourists on food and drink thus averaged THB 1,393.1 per person per day compared to an average of THB 567.9 per person per day for domestic tourists12/ (data correct as of 2022).
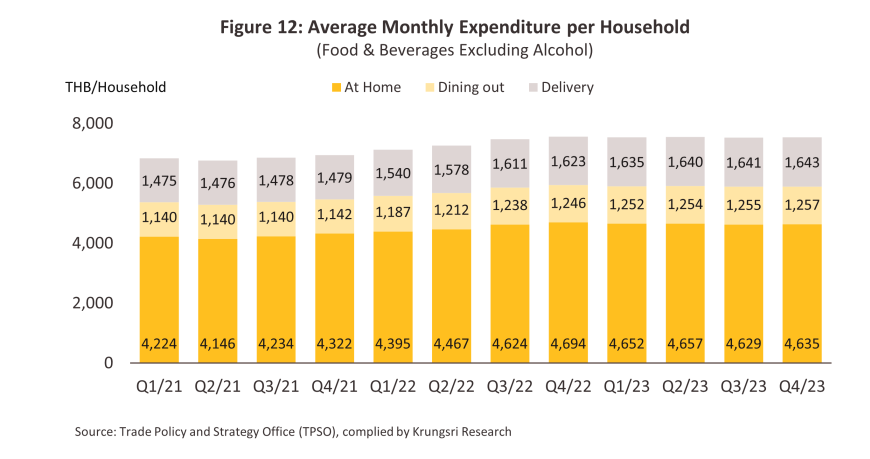
In summary, demand-side factors affecting operators in the food and beverage industry include the following. (i) Because the industry is dependent on tourist spending, the outlook for the tourism industry and the number of domestic and international tourists is very important. (ii) The state of the domestic economy broadly determines spending power and demand for restaurant services. In 2022, GDP grew by 2.6% as the economy began to recover from the pandemic, and so average household spending on dining out rose 7.0% from THB 1,140.3/month to THB 1,220.6/month, while spending on food deliveries climbed from THB 1,476.9/month to THB 1,587.9/month (up 7.5%) (Figure 12). (iii) consumer behavior has shifted towards dining out more frequently, especially after the easing of COVID-19. This trend is also driven by urbanization and the increasing role of social media through the internet. Factors include the opening of new restaurants, sharing dining experiences, promoting restaurants through online advertising, engaging customers by sharing interesting food stories, and offering special promotions. This is partly because the internet penetration rate in Thailand is high, currently increasing to 77.8%, compared to 69.5% in 2021 (Source: Datareportal).
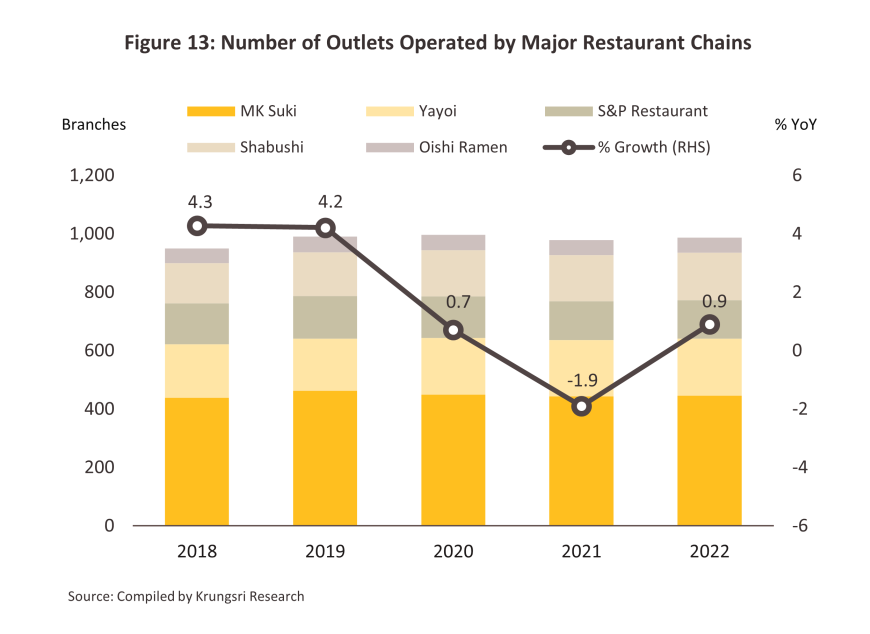
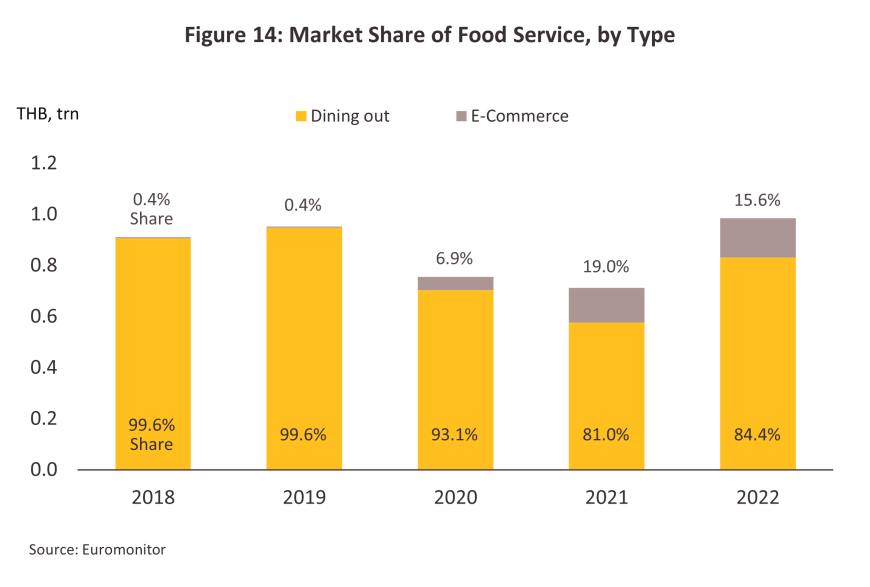
On the supply side of the market, some of the more important factors affecting the industry involve the following. (i) Business operations are relatively straightforward, meaning that barriers to entry to the market are very low and there is thus a constant flow of new players adding to supply. This then keeps competitive pressures high. (ii) Ongoing urbanization is supporting growth in the size and coverage of restaurant chains (Figure 13), especially for sites in shopping centers, department stores, and community malls in tourist areas and major regional centers. (iii) Consumers are increasingly reliant on the use of food delivery applications such as Grab Food, Foodpanda, and Lineman, and this is adding to the distribution channels through which restaurants and diners can connect (Figure 14).
Situation
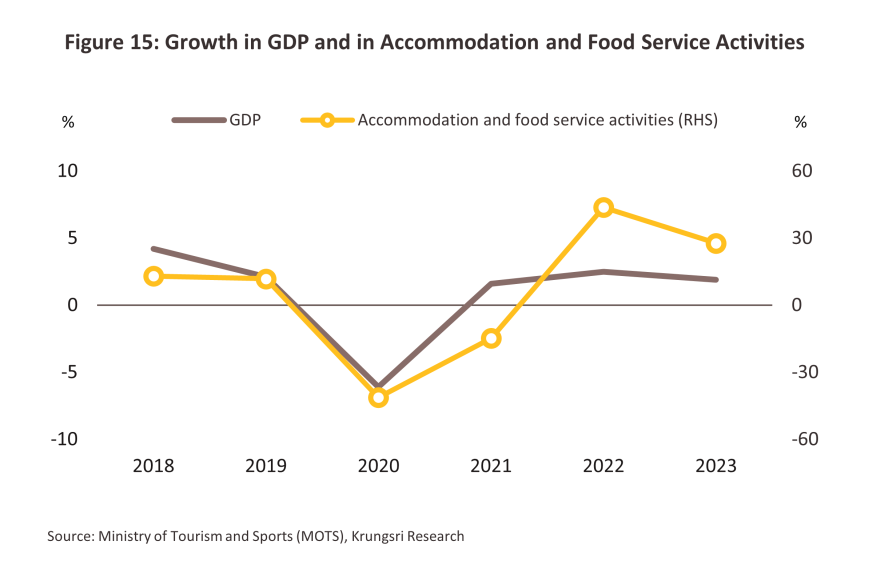
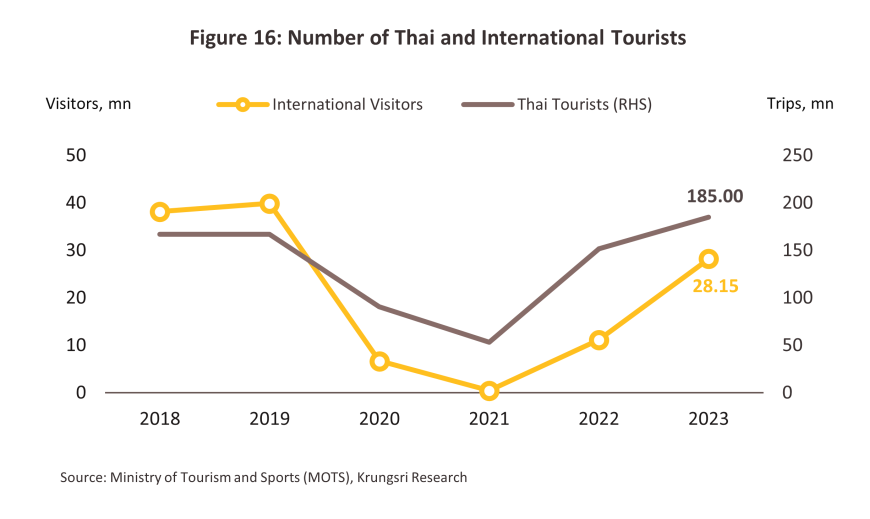
Demand for food and drink rose strongly in 2023, and this was reflected in the 27.7% increase in the contribution of accommodation and food service activities to overall GDP (Figure 15). An improving outlook for the tourism sector was an important factor behind this, and this was in turn helped by: (i) government stimulus measures promoting domestic travel; and (ii) the reopening of the country to foreign arrivals. As a result, the number of foreign tourists coming to Thailand surged 152.5% to 28.15 million tourists in 2023, while domestic tourists took 22.1% more trips, the total of these thus rising to 176.2 million trips (Figure 16).
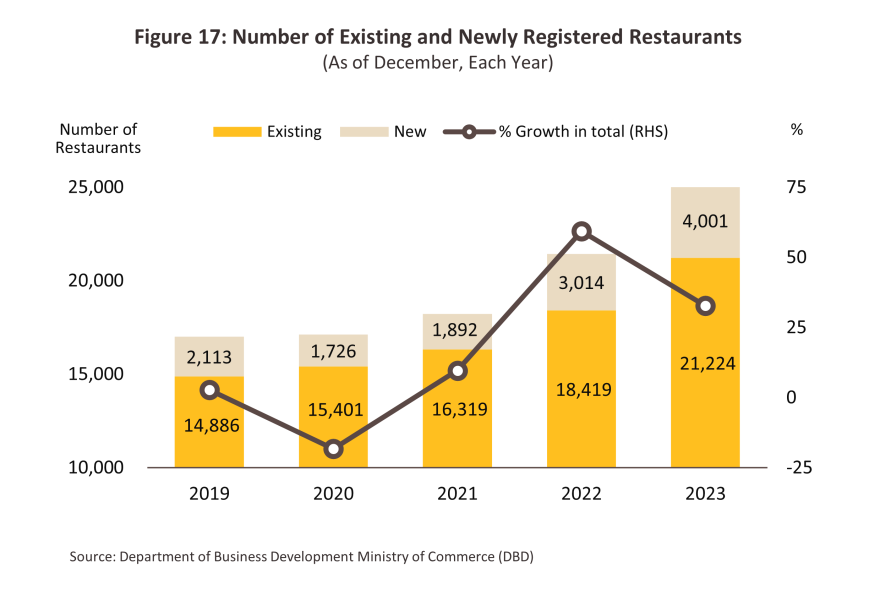
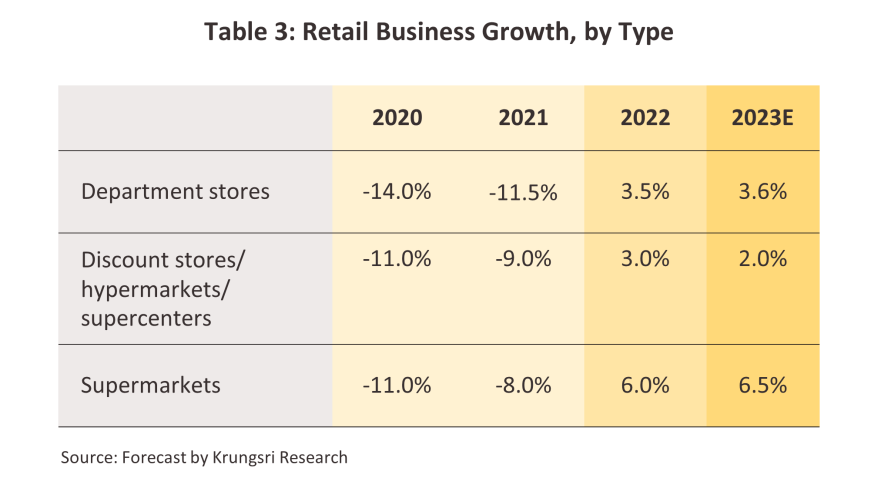
Supply rose in step with demand and so in the year, the total number of registered corporations operating as restaurants increased by 15.2% to a total of 21,22413/ (Figure 17), though the number of newly registered restaurants jumped 32.8% to 4,001. These were concentrated in tourist areas, the most important of which was Bangkok (home to 1,287 newly registered restaurants), followed by Chonburi (481 restaurants), Phuket (371), Chiang Mai (271) and Surat Thani (211). In addition, operators of food delivery apps have tended to adapt to the return of economic and social life to normal by adding new functions, such as dine-in features that offer discounts to those eating-in in restaurants. The ongoing expansion of the modern trade industry is also helping to increase the reach of food and beverage services (Table 3).
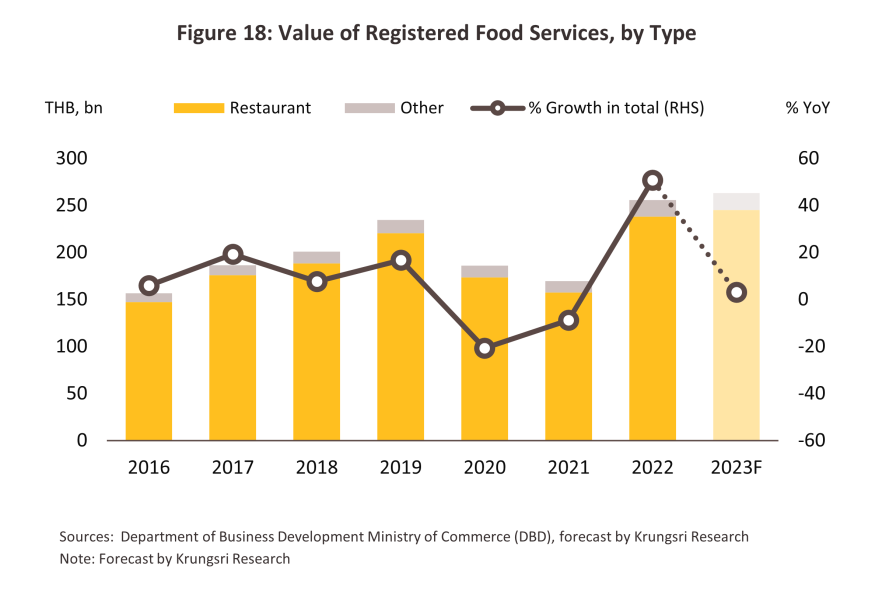
Given the factors above, 2023 revenue for registered food and beverage companies are expected to have risen by 2.5-3.5% to THB 262.0-264.5 billion (Figure 18). Growth will have been helped by the 2.8% increase in spending on eating out (up to THB 1,254 per household per month), the 3.3% increase in spending on food delivery services (up to THB 1,640 per household per month) (Figure 13), and general recovery in demand from the tourism sector.
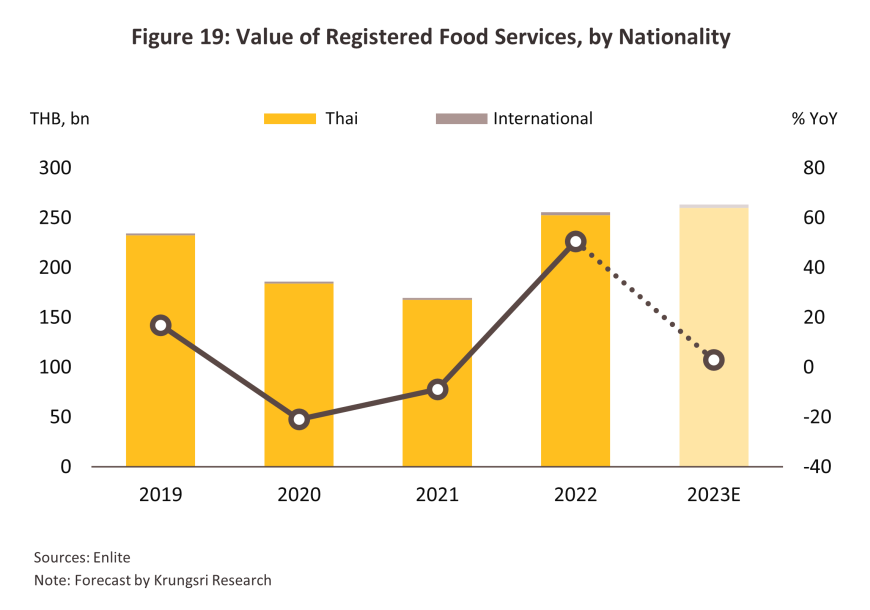
Industry revenue will still be overwhelmingly generated by Thai companies, though the share will edge down very slightly from 98.8% to 98.7%. The corresponding rise in the share of income coming from foreign-owned companies from 1.2% to 1.3% will be due to rising investment in the industry by foreign companies, especially by Chinese players (Figure 19).
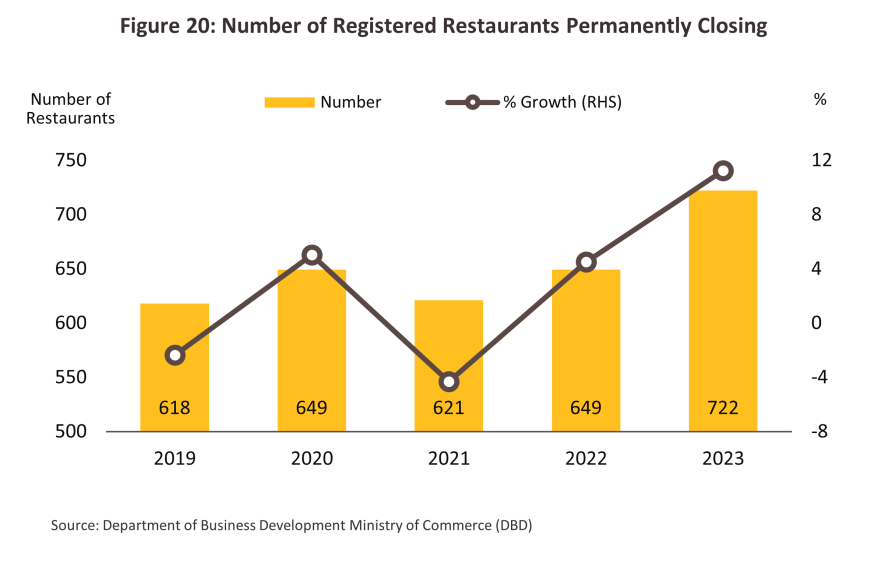
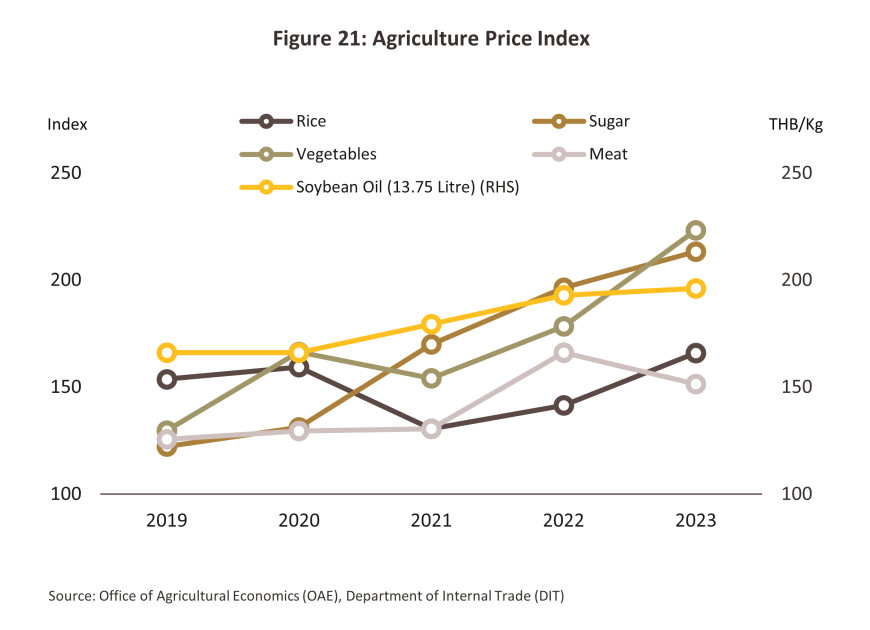
Despite the improving outlook, the restaurant industry continued to face a range of challenges through 2023, including: (i) stiff competition that then forced 722 registered restaurants out of business, an 11.2% increase on the 649 that closed in 2022 (Figure 20); and (ii) the rising cost of ingredients (the industry’s most significant source of operating costs14/), for example for rice (17.3%), sugar (8.6%), vegetables (25.1%) and soybean oil (1.7%) (Figure 21). This then forced companies to raise their prices or to cut back on serving sizes against a backdrop of intensifying competition.
Outlook
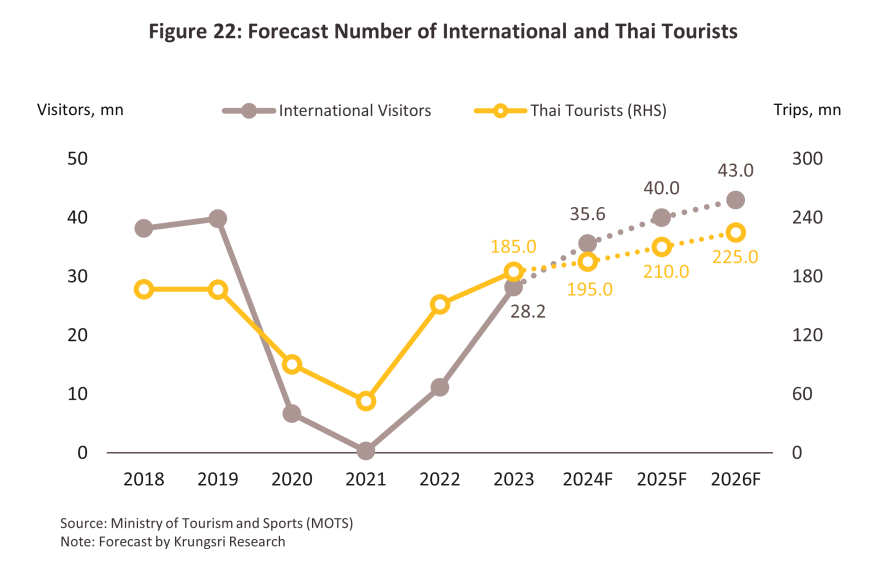
Krungsri Research expects that over 2024 to 2026, demand will gradually strengthen, helped by the following factors. (i) Steadily improving labor markets, falling inflation, and progress on the buildout of new infrastructure will all support ongoing economic growth. (ii) The tourism sector will continue to strengthen, especially in the main markets of China, Malaysia, and South Korea as airline services return to normal and continuing government stimulus measures (most notably visa-free travel for arrivals from some countries) buoy the market. Foreign arrivals are thus forecast to return to the pre-Covid total by 2025. Likewise, the domestic market will see ongoing expansion, again helped by government measures targeting the tourism industry (Figure 22). More direct help has also come in the form of the decision to allow nightspots to stay open until 4am, with this initially allowed in tourist areas in Bangkok, Phuket, Chonburi, Chiang Mai and Koh Samui from 15 December, 2023. Naturally, this should help to boost income for food and beverage services. (iii) the increasing role of the internet and social media in consumer behavior is evident through the sharing of photos and experiences by social media influencers and online advertisements. Additionally, food-loving communities often recommend new restaurants and special offers, continuously boosting sales. This trend stimulates interest in discovering new dining locations in various areas.
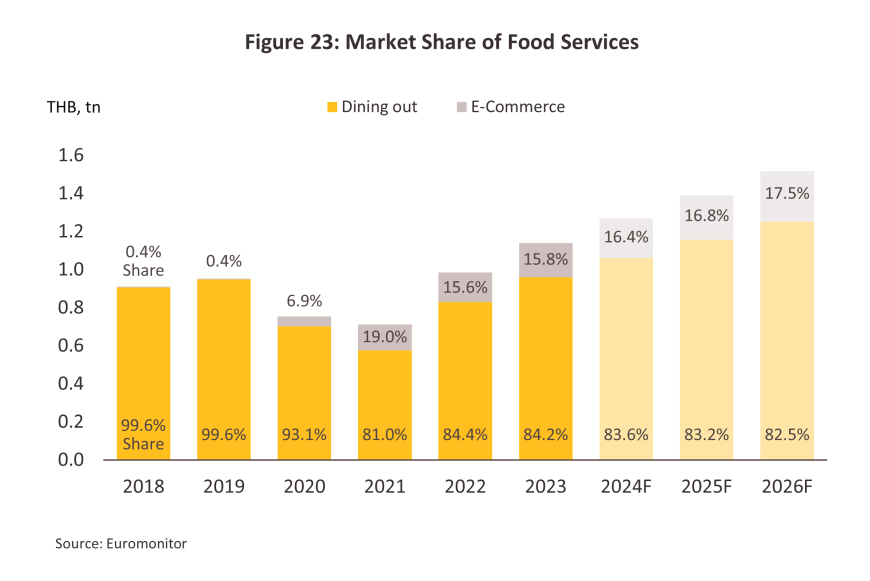
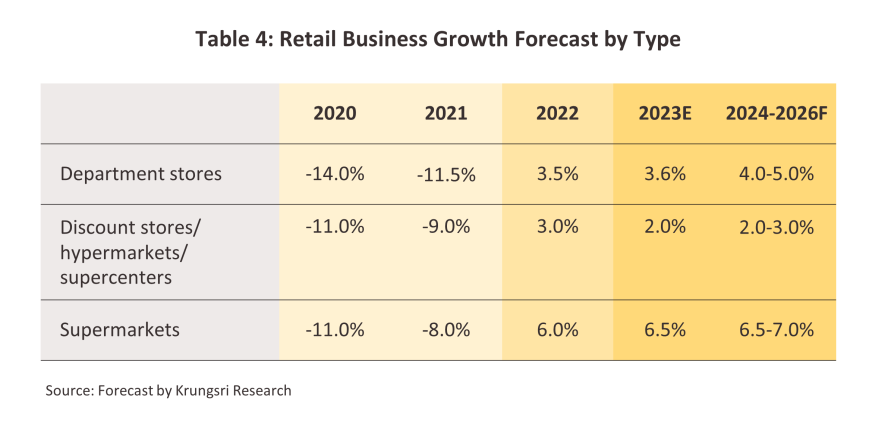
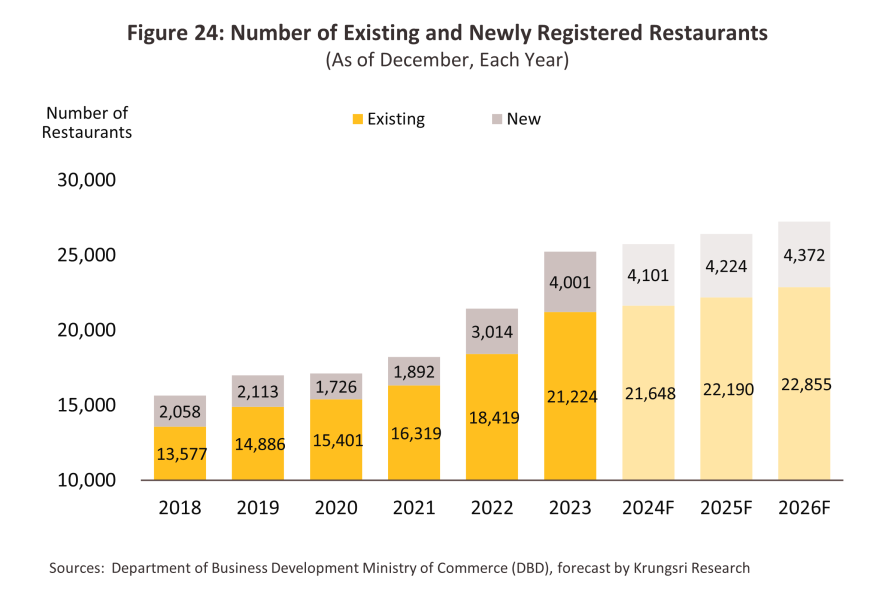
Growth in supply will be supported by: (i) a more efficient logistics system, such as Cold Chain Logistics, has resulted in better food quality preservation. This development facilitates the opening of restaurants in areas far from sources of ingredients; (ii) the addition of new features to food delivery apps (Figure 23) in response to the increasing penetration of these apps into regular day-to-day life, with the result that restaurants are now better able to connect to their markets and to offer discounts and incentives to potential diners; and (iii) growth in large and small retail outlets (table 4) both in Bangkok and upcountry. This is especially true in high-potential business locations or new tourist spots to accommodate the resurgence of economic activities and consumption, as well as the growth of the tourism sector. These supply-side factors are expected to support the increase in the number of restaurants by 2.0-3.0% (Figure 24).
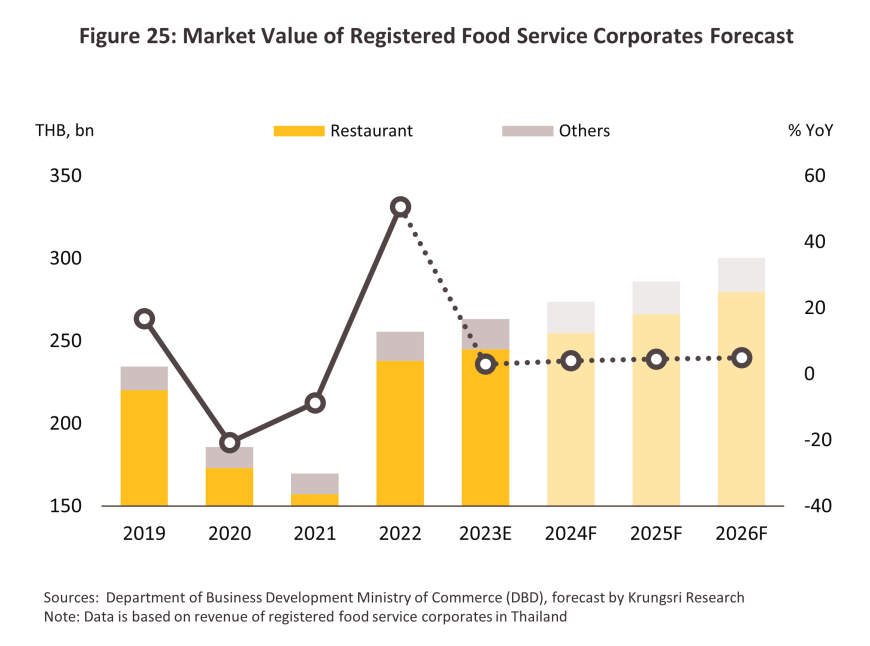
In light of the above and the positive impacts of both demand- and supply-side factors on the industry, corporate food and beverage service providers will enjoy average revenue growth of 4.0-5.0% annually over the next three years, taking yearly market value to THB 275-300 billion over 2024-2026 (Figure 25).
Challenges
-
Competition is stiff within the restaurant industry, partly due to growth in shopping centers and the resulting rise in the number of restaurant chains opening in these and in other sites, such as petrol stations. Foreign players are also entering the market in increasing numbers, and these typically enjoy advantages with regard to their access to capital, the commercial networks within which they operate, and their multilingualism, and this then helps these companies adapt better to changing trends in food consumption. As a result, it is becoming increasingly difficult for SMEs to remain profitable. Data from the Office of Small and Medium Enterprise Promotion shows that around 40% of Thai restaurant businesses have been in operation for less than 3 years.
-
Volatility in the cost of inputs will be driven by: (i) climatic changes, particularly attributable to the El Niño/La Niña cycle over the short term and their impacts on agricultural yields and prices; and (ii) potential increases in the price of crude, which would then add to the cost of outputs such as electricity and cooking gas.
-
Economic growth may underperform, while inflation remains elevated and domestic levels of household indebtedness are still very high (91.3% of GDP as of Q4 2023). This may then erode purchasing power and encourage Thai tourists and consumers to exercise greater care over discretionary spending.
-
Growth in the ‘cloud kitchen’ market15/ is pushing consumers to cut back on unnecessary spending, for example on dining out or buying more expensive food. Indeed, this is already a substantial market, and Statista estimates that sales made through app-based food delivery services across Southeast Asia will be worth around USD 37.5 billion in 2024.
-
Consumers are increasingly concerned about food safety and hygiene, and this is putting pressure on players to adjust their offerings by introducing products made from organic inputs, low-fat meats, and plant-based proteins. In addition, the market is encouraging companies to use more environmentally friendly packaging, and this is all adding to costs.
Transformation towards Sustainability
It is becoming increasingly important for businesses to focus much more heavily on their sustainability. players in the food and beverage industry are therefore now competing to overhaul their business operations and products and to ensure that their use of resources is as efficient as possible. In particular, this tends to emphasize compliance with ESG (environmental, social and governance) principles and the reuse of resources and inputs.
-
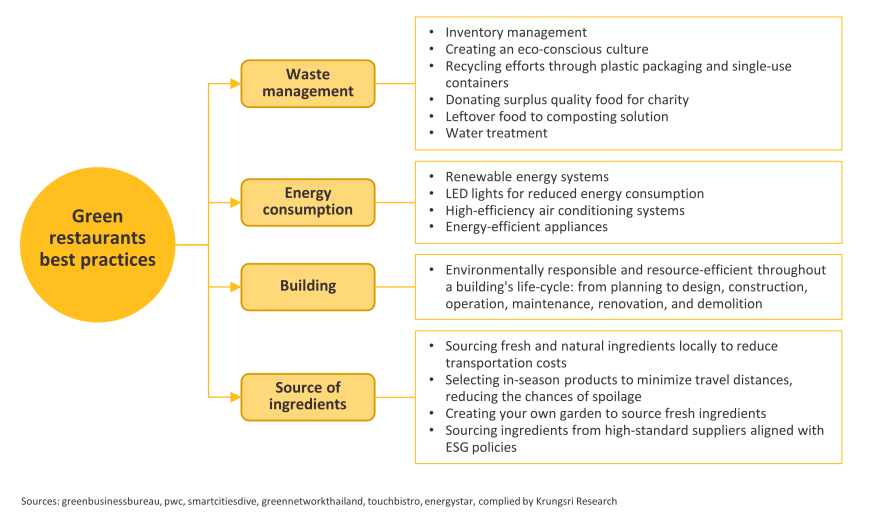
Environmental: players are beginning to adapt by: (i) using power generated from solar cells; (ii) reduce water usage; (iii) treating waste water before this is discharged; (iv) using refrigerants that do not contribute further to climate change; (v) using EVs instead of ICE-powered motorcycles for delivery services; (vi) cleaning and separating plastics and then recycling these, and using organic waste to make compost or animal feed rather than sending this to landfill; and (vii) greening the entire restaurant lifecycle and reducing environmental impacts, from design and the use of materials and technologies through to construction.
-
Social: Many companies are increasing their involvement in social responsibilities by: (i) working harder to hire people with disabilities; (ii) helping children access education through grants and other financial aid; and (iii) donating surplus food that still has good quality to charities for distribution to those in need.
-
Governance: This encompasses areas relating to the enterprise, its customers, and its stakeholders, and in the case of restaurant businesses, this may extend to include issues such as animal welfare. For example, restaurants operated by Baan Ying Group16/ and Mo Mo Paradise17/ have moved to use only eggs sourced from cage-free flocks.
These changes will likely add to business overheads connected to the provision of both goods and services, but because the scope for passing these increases on to consumers is limited by current weakness in spending power, this may put downward pressure on profits.
1/ For example, restaurants offering self-service food and drink facilities, or taking advantage of self-service payment systems.
2/ Source: Office of Small and Medium Enterprise Promotion (OSMEP) and Department of Business Development
3/ Source: Department of Employment (Ministry of Labour)
4/ TSIC 56101
5/ Foods stalls and market sellers (TSIC 56102), mobile food businesses (TSIC 56103), sellers of alcoholic beverages (TSIC 56301), sellers of non-alcoholic beverages (TSIC 56302), beverage stalls and market sellers (TSIC 56303), and mobile beverage businesses (TSIC 56304)
6/ Growth potential is determined by a combination of four factors: (i) the business’s basic features; (ii) the business owner’s skills and abilities; (iii) business operations; and (iv) business performance.
7/ Calculated from the 2022 company accounts of 9,022 businesses included in the TSIC categories 56101, 56102, 56103, 56301, 56302, 56303 and 56304.
8/ For the period 2015-2022.
9/ These sell under a single brand and expand either through investments made by the company itself or through franchising arrangements (source: https://www.smartsme.co.th).
10/ For the period 2015-2022.
11/ For the period 2015-2022.
12/ Source: Ministry of Tourism and Sports
13/ Source: Department of Business Development. Data correct as of December 2023.
14/ Raw materials account for 57.9% of all costs for food and beverage service activities (source: Office of the National Economic and Social Development Council (NESDC)’s 2015 Input-Output Table, Krungsri Research).
15/ Cloud Kitchen is a food business model that operates without a physical storefront, focusing on using kitchen space solely for preparing food for sale through online channels.
16/ Source: thaipr.net
17/ Source: Mo-Mo-Paradise (Thailand) Facebook Page


.webp.aspx)