EXECUTIVE SUMMARY
The rubber industry will benefit from an improving business environment through the period 2023 to 2025 thanks to both rising outputs and firmer demand. On the supply side, players will enjoy an expansion in the total size of rubber plantations, what is expected to be more favorable climate, and the incentive effects of higher prices on the care and upkeep of rubber stands, all of which will translate into greater output. At the same time, supply from Indonesia and Malaysia will struggle to recover fully from problems with labor shortages and the effects of leaf drop disease. Meanwhile, the demand side of the market will benefit from: (i) growth in downstream industries at home and abroad, including the automotive sector (helped further by Thai government support for the development of domestic EV production), the manufacture of rubber gloves, and the production of medical devices; (ii) stronger spending on the build out of new infrastructure, which will then support greater demand for rubber for use in construction; (iii) government measures to stabilize rubber prices; and (iv) greater demand for natural rubber in place of synthetic rubber, the cost of which is climbing with rising prices for crude. Nevertheless, the industry will have to face the growing threat from non-tariff barriers to trade as well as the increasing risk of competition from players in the CLMV countries, where earlier Chinese investment in rubber plantations is now paying off in terms of a rapidly increasing market share.
Krungsri Research view
Midstream rubber producers will enjoy an overall rise in turnover over the next 3 years, but players will also have to wrestle with increasing output from neighboring countries and the effects of this on intensifying competition. In addition, income will come under threat from the switch by growers to crops that provide higher returns, the effect of this year’s El Niño on rainfall, and the rising cost of inputs.
-
Rubber growers: Income will tend to stay flat due to a combination of downward pressure on prices and the effects of outbreaks of leaf drop disease on outputs, which will then amplify the effects of escalating production costs, especially of labor and fertilizer. At the same time, growers will benefit from government assistance for the industry, including price-stabilize measures.
-
Rubber traders: Income will be uncertain for this group because distribution channels are narrowing with the trend by processors to buy directly from growers, central markets and cooperatives. Moreover, Chinese operators are increasingly traveling to Thailand to buy from rubber farmers directly, thus cutting Thai traders out of supply chains, while the market is also evolving with the switch by Chinese importers to a greater reliance on producers in the CLMV countries.
-
Producers of intermediate products: Overall income will tend to rise, though only at a limited rate. Manufacturers of sheet rubber and TSR will benefit from rising demand for imports into China and Europe thanks to a combination of a better outlook for auto, tire and EV manufacturers, although as supply from growers in the CLMV countries expands, players will face a corresponding stiffening of competition. The outlook for producers of concentrated latex is also positive, and these players can look forward to opportunities for ongoing growth thanks to anticipated increases in demand from downstream manufacturers of latex gloves and medical supplies, though supply may also be affected by the expansion in production capacity that the COVID-19 pandemic triggered. Likewise, producers of compound and mixed rubber1/ will also gain from an improving business environment that will be lifted by rising demand from Chinese tire and auto parts manufacturers, especially from within the EV segment, as well as by recovery in the manufacturing sectors in major overseas markets, including Malaysia, India, the US, and Europe. However, Thai players will need to deal with the impact of more expensive crude on the cost of synthetic rubber and/or other chemical inputs used in the production. In addition, Chinese investment in domestically produced upstream and midstream rubber products is rising, and this will limit the market space within which Thai exports may expand.
Overview
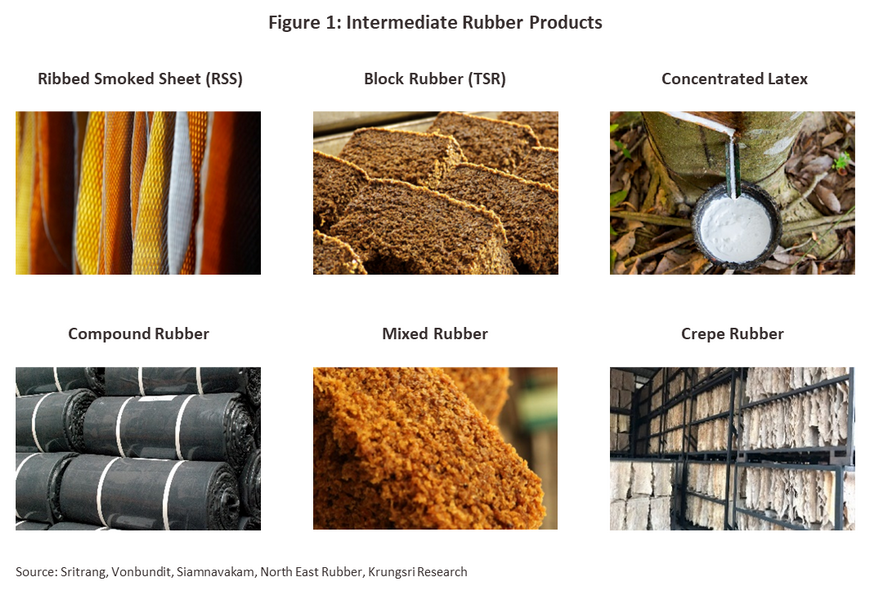
The Thai rubber supply chain has three main components. (i) Upstream industries involve the growing and harvesting of rubber on plantations by growers and tappers, but to add value to primary production, some farmers engage in basic processing of their field latex to produce dried rubber products such as cup lump, scraps, sheet and crepe rubber2/. Almost all upstream production in Thailand is consumed as inputs into the domestic midstream rubber industry. (ii) Intermediate/midstream rubber industries, or rubber processors, take rubber produced on plantations3/ and convert this into semi-finished products, such as ribbed smoked sheet, technically specified rubber, concentrated latex, compound rubber, mixed rubber and skim rubber. These have the qualities and properties required for use as inputs into the different downstream production processes. (iii) Downstream producers include manufacturers of items such as automobile tires, latex gloves, condoms, elastics, and so on, although synthetic rubber, which has been developed by the petrochemical sector4/, is used in place of midstream, natural rubber products in applications where its qualities make it more suitable.
The majority of Thai-produced intermediate rubber goods is sold on overseas markets for processing into downstream products (as of 2022, 80.9% of Thai intermediate goods were sold abroad), with the most important export markets being China (53.8% of all exports of Thai intermediate goods), Malaysia (10.6%), the United States (5.7%), Japan (4.6%) and South Korea (4.5%). The remaining 19.1% of midstream production is consumed domestically, and here, the most important end-use is for the production of tires (the source of 58.6% of all domestic demand for intermediate rubber products). Tires are followed in importance by latex or surgical gloves (10.2%), elastics (9.3%) and then other products such as hosing, condoms and rubber bands (Box 1).
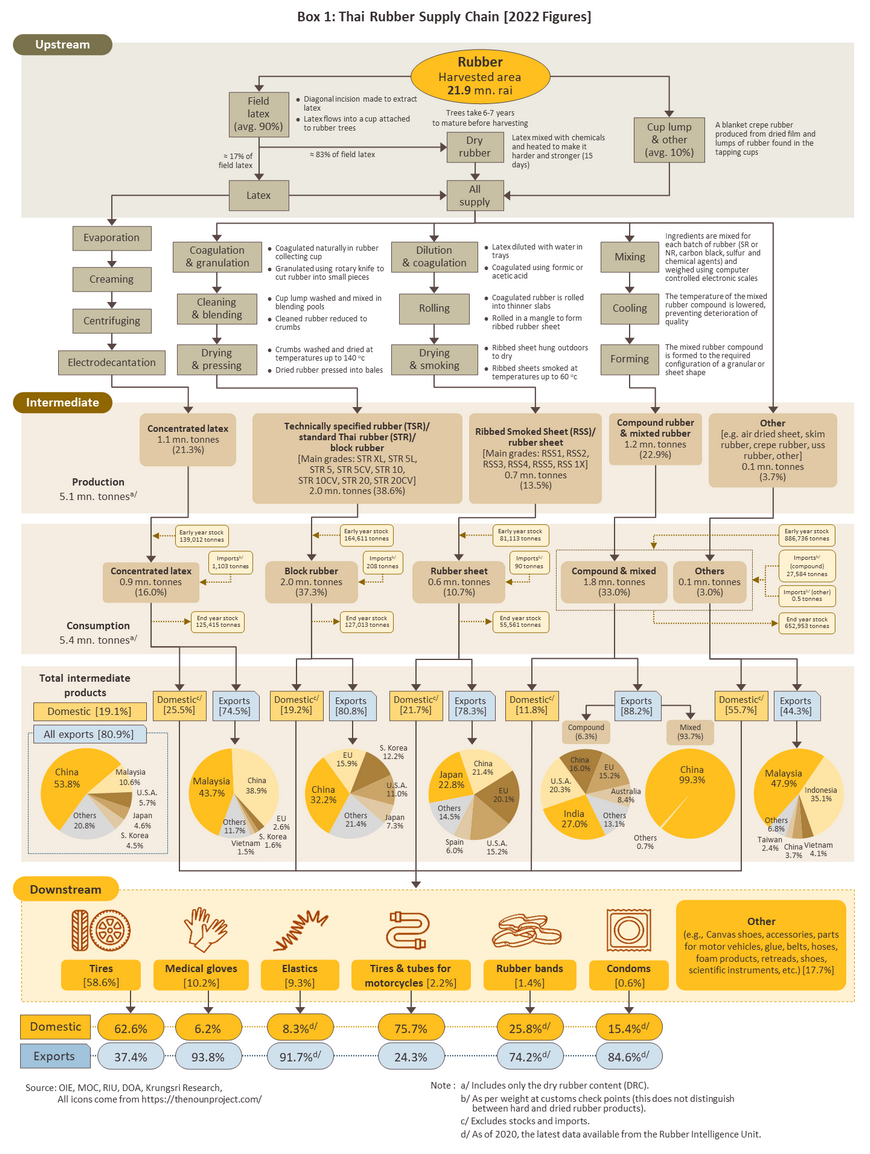
In 2022, the total value of intermediate rubber production in Thailand came to around THB 336 billion5/. Thailand is in a fortunate position because its production is overwhelmingly of fresh rubber, or field latex, (an average of 90% of upstream production is of this6/) and because this can be used as an input for processing into all types of midstream rubber goods, Thailand’s intermediate rubber production is very diversified. The remaining production is of dried rubber, produced from cup lump7/, rubber scraps8/ and other rubber products. This differs from the situation in other major rubber-producing countries such as Malaysia and Indonesia, where upstream production is split between latex and cup lump in ratios of respectively 10:90 and 60:40, which is largely used for conversion into technically specified and smoked sheet rubber.
Given this, the output from Thai intermediate rubber production encompasses sheet rubber, technically specified rubber (TSR), concentrated latex, compound rubber, mixed rubber, and other products, though of these, TSR is the most important, accounting for 38.6% of all production by volume.
-
Ribbed smoked sheet (RSS) is produced by first filtering field latex to remove dirt and impurities. This filtered latex is mixed with concentrated formic acid, which causes the rubber to coagulate. These solids are then rolled into raw sheet rubber before being dried in the sun for around six hours to produce air-dried sheets. If these sheets are then smoked or dried further, a process that reduces the moisture content and with this, the risk of fungal infection, these are called ‘ribbed smoked sheet’ (RSS). The resulting dried sheets can be stored for longer periods of time than can other types of rubber.
-
Ribbed smoked sheet is graded according to its quality on a 6-point scale that goes from 1X (the best) and then from 1 through to 5 (the worst). Grading is made according to a variety of criteria, including the number of air bubbles in the product, the proportion of dirt and other impurities, its color, the consistency of the material, and so on. Over 95% of Thai output is of grade 3 RSS, a standard quality that has properties equivalent to TSR, and this can be used in the production of goods such as tires, belts, hosing, auto parts, and shoes.
-
As of 2022, the combined value of the domestic and export markets for RSS stood at just THB 38 billion, down from THB 132 billion in 2011. This thus represents an average annual decline of -10.6% (CAGR over 2011-2022). This sharp worsening of the business environment is attributable to increasing competition for market share from players in other ASEAN countries, including Cambodia, the Philippines, Myanmar, Vietnam and Lao PDR, though with a 33.8% share of all global exports of RSS, Thailand has maintained its leading position in the market (Figure 2). In fact, Thailand exports 78.3% of its output of RSS. Thailand’s major export markets include Japan (responsible for 22.8% of all Thai RSS exports), China (another 21.4% of exports), and the EU (20.1%) (Box 1). The remaining 21.7% of output of RSS is consumed domestically.

-
Technically specified rubber (TSR) is made from either field latex or some form of dried rubber such as sheet rubber, cup lump or scrap rubber, that is separated into small pieces, washed, dried, and cut into bars. TSR produced in Thailand is typically made from one of two inputs. (i) Field latex produces a product with good physical properties (i.e., it has the preferred levels of purity, viscosity and flexibility) and this is therefore suitable for use in manufacturing high-quality goods such as radial and aircraft tires. This type of TSR is also used to manufacture products such as elastic bands, hair bands, sports goods, and other miscellaneous components and parts. Standard Thai Rubber (STR), which is made from field latex, is divided into the three grades9/ of STR XL, STR 5L and STR 5, with the majority of Thai exports being STR 5L. (ii) TSR can also be made from dried rubber, but this may be inconsistent and lack uniformity because the manufacturing process involves using and mixing different types of rubber inputs. These products are divided into two grades10/: STR 20 (made principally from rubber scraps that are mixed with sheet rubber, cup lump or RSS) and STR 10 (made from high-quality sheet rubber and cup lump). Most Thai TSR made from dried rubber is of the former type, which is then bought by downstream tire manufacturers.
-
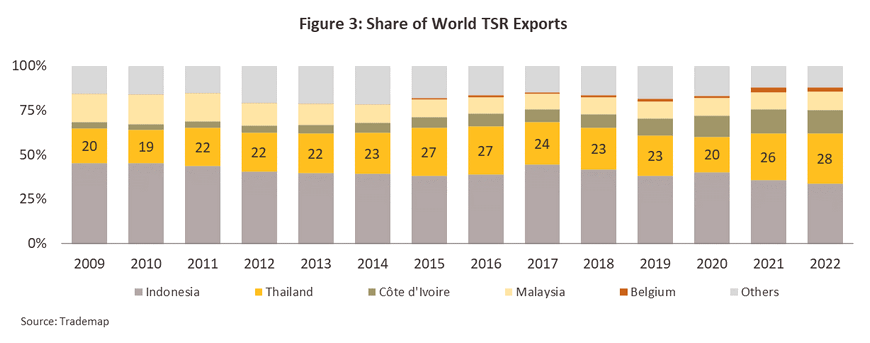
In total, the Thai rubber industry produced THB 120 billion’s worth of TSR in 2022, 80.8% of which was sold on overseas markets. This was sufficient to give Thailand a 28.3% share of the global market, second only to Indonesia (Figure 3). Thailand’s main export market is China (which in the year took 32.2% of all exported Thai-made TSR by quantity), the EU (15.9%) and South Korea (12.2%). Almost all TSR sold on the domestic market (19.2% of output) is used in the manufacture of tires (Box 1).
-
Concentrated latex is produced by passing field latex through high-speed centrifuges that separate out water and any impurities that are dissolved in this. Generally, field latex is no more than 33% rubber, making it unsuitable for use directly, but concentrated latex is at least 60% rubber, and so this has the qualities required for use as a raw material in further processing, most often in the production of medical supplies and devices.
-
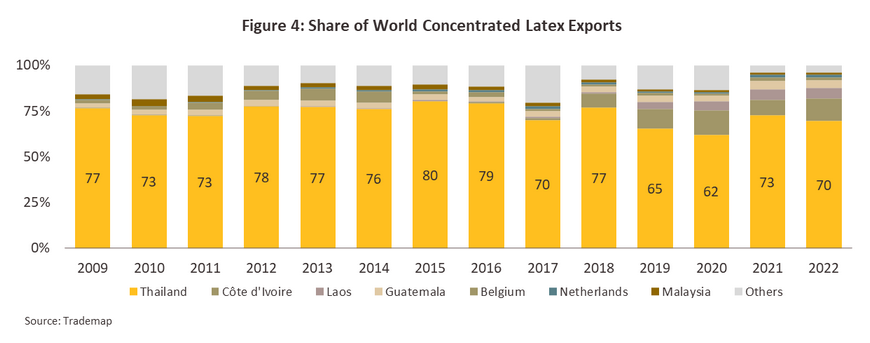
In 2022, Thai players distributed roughly THB 64 billion’s worth of concentrated latex to the market. 74.5% of this went to overseas buyers, with the remaining 25.5% of output thus consumed domestically. Controlling around 70% of global supply, Thailand is comfortably the world leader in this segment, though over 2019 and 2020, its share of the global market declined on a pandemic-driven increase in domestic demand (Figure 4). As a result of the outbreak of COVID-19 and greater demand for medical supplies, the domestic share of the total market for concentrated latex rose from an average of 20% to 24.1-34.4%, or from an annual average of 0.18-0.19 million tonnes over 2015-2018 to 0.22-0.36 million tonnes and as such, players switched to a greater focus on the domestic market over 2019-2022. At the same time, buyers of Thai rubber products also increased purchases from suppliers in other countries, with Malaysia (Thailand’s biggest export market, with a 43.7% share) and China (a 38.9% share) turning to a greater reliance on imports from Vietnam (Box 1). Most exported concentrated latex is used in the manufacture of latex gloves and condoms.
-
Other important segments within the rubber industry include compound rubber. This midstream product contains natural rubber mixed with other chemicals11/ such as vulcanite, catalysts, and fillers, which are added to produce a material that has the properties required for particular downstream forming processes. Examples of the latter include the manufacture of tires, latex gloves, rubber bearing pads, hosing and elastic ties. Mixed rubber/Mixture rubber is another midstream product that contains a mixture of natural rubber, synthetic rubber, and/or other chemicals. This then makes it suitable for use in the production of finished goods such as hosing, insulating materials, conveyor belts, packing, and shoe soles.
-
Sales of compound and mixed rubber generated receipts of THB 106 billion for Thai players in 2022. In the year, 88.2% of output was distributed on export markets, leaving 11.8% to be consumed domestically.
-
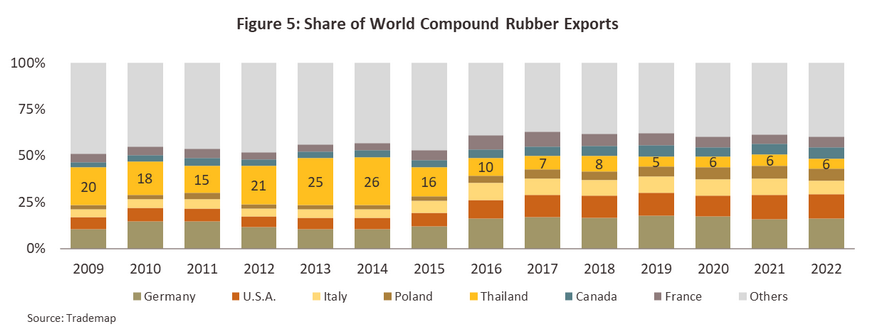
Compound rubber: Thailand is the world’s fifth most important source of compound rubber, sitting behind Germany, the US, Italy, and Poland in the global rankings (Figure 5). Thailand’s share of the global market slipped from an average of 8.0-10.0% over 2016-2018 to 5.5-6.0% over 2019-2022. This was a result of some players switching from producing compound rubber to instead outputting concentrated latex as they shifted to a stronger focus on meeting rising domestic demand, which was driven by the pandemic and the need to increase production of latex gloves. In 2022, India was Thailand’s most important export market, and the country soaked up 27.0% of exports during the year. India was followed in importance by the US (20.3% of exports) and China (16.0%) (Box 1). Thai-made compound rubber is generally 80-85% natural rubber, though the exact proportion will depend on demand in particular export markets and the final uses to which the rubber will be put.
-
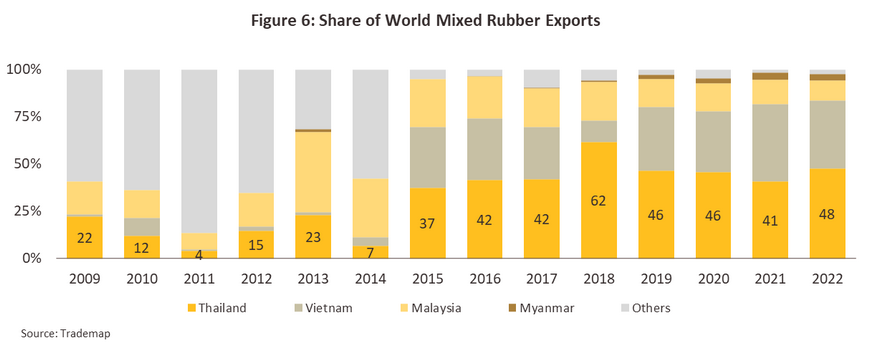
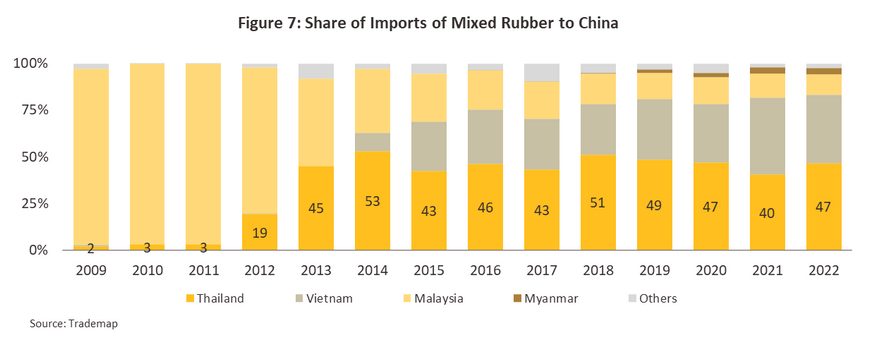
Mixed rubber: Thailand is the world leader in the global market for mixed rubber, followed by Vietnam and Malaysia (Figure 6). Thailand’s market share expanded rapidly in 2015, growing from an average of 4.0%-23.0% over 2009-2014 to 46.0-48.0% over 2019-2022. The global market is almost entirely accounted for by China, with the country representing a full 98.9% of exports. In a very distant second place to China is Italy (0.5% global share) and then India (0.3%), and so given its absolute dominance, it is unsurprising that in 2022, 99.3% of Thai exports of mixed rubber were bound for China. Thailand’s secondary markets were India (0.7% of exports of mixed rubber) and Vietnam (0.1%) (Box 1). Nevertheless, despite the importance of China to Thai exporters, the latter represents only 46.6% of imports, with an additional 36.6% coming from Vietnam and 11.0% from Malaysia (Figure 7). Thai mixed rubber is typically 90-95% natural rubber, with the balance made up of synthetic rubber and/or other chemicals, though the exact ingredients and the proportions used will depend on the material’s final uses.
The Thai rubber industry’s reliance heavily on exports means that midstream Thai operators have to manage a high degree of exposure to changes in both the health of the global economy and the state of downstream industries in export markets. Moreover, because Thai exporters are generally dependent on only simple production methods and have low levels of product differentiation, Thai midstream players are subjected to high levels of competition. In 2022, the global supply of natural rubber came to 14.4 million tonnes, of which 33.4% came from Thailand, this being sufficient for Thailand to retain its place as the world’s primary source of rubber. Thailand is followed in importance by Indonesia, Vietnam, Côte d’Ivoire, India and China (Figure 6), and indeed overall, Asia is the source of over 80% of the world’s rubber. Thailand’s main competitors are thus other ASEAN producers, and in particular, Indonesia, Malaysia and the CLMV group (Cambodia, Lao, Myanmar and Vietnam) (Figure 8), all of which are, like Thailand, suffering from a supply glut12/. Nevertheless, despite these rising threats to its dominance, the Thai intermediate rubber industry has retained its place as the world leader, and it is still the number one supplier to global markets of concentrated latex and mixed rubber, and the second most important source of TSR.
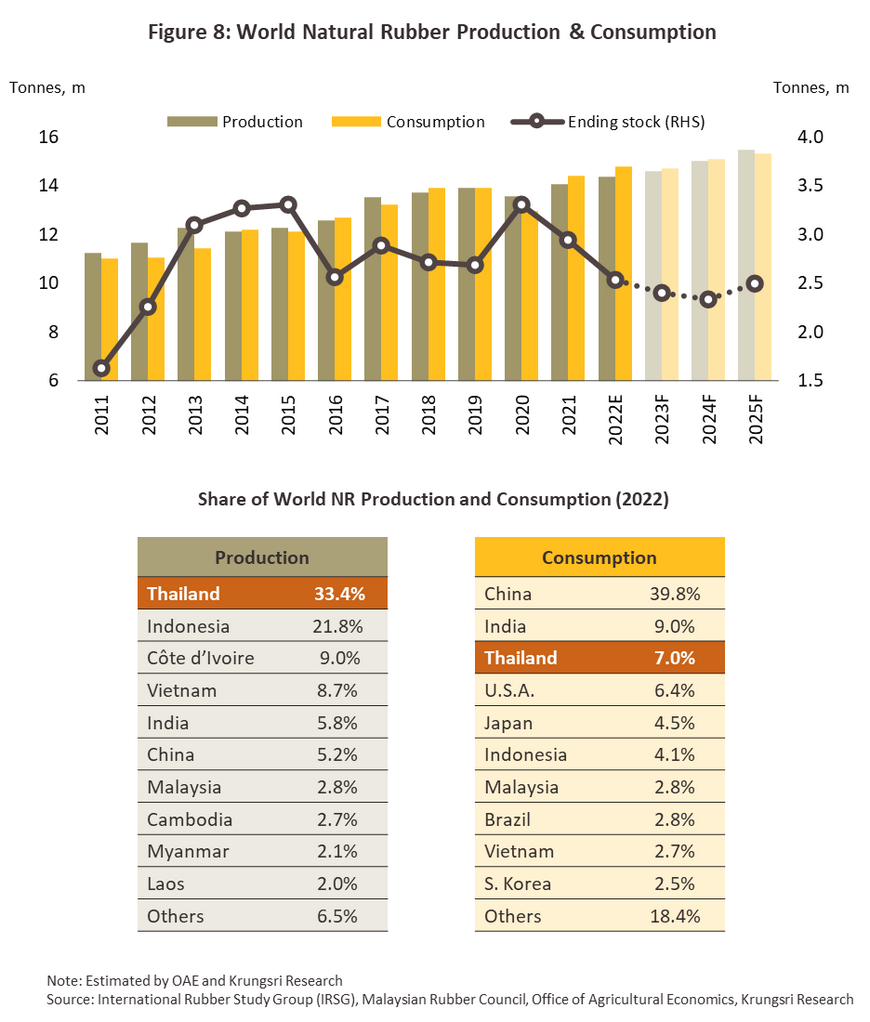
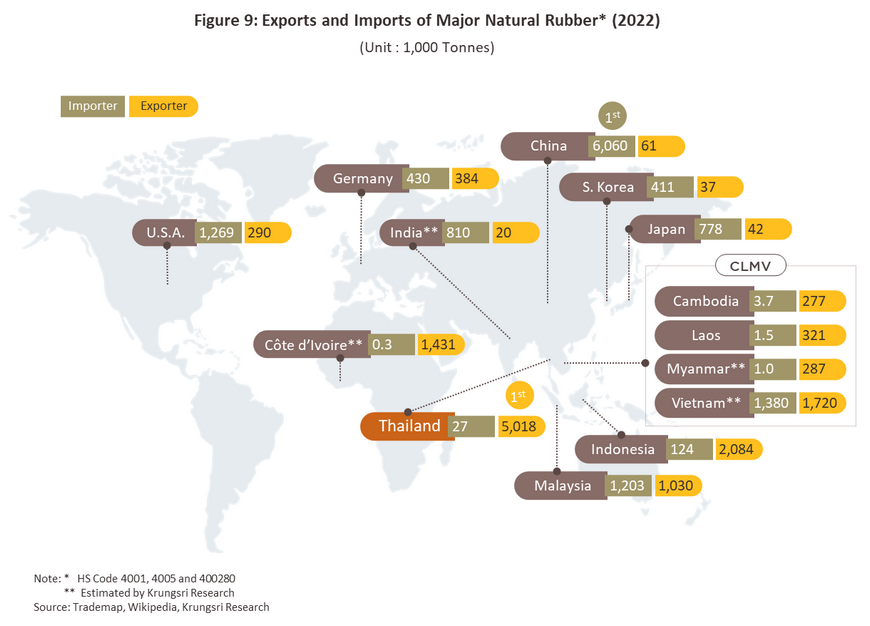
As regards demand for rubber products, globally this totaled 14.8 million tonnes in 2022. The most important source of demand is the auto and auto parts industry, which is followed in importance by the medical devices industry (including the production of latex gloves), and the construction industry, both general and infrastructure. China is the world’s most important market for rubber, which accounted for 39.8% of global consumption and 46.8% of global imports, followed by India, Thailand, the US, and Japan (Figure 8 and Figure 9). Given this and the way the market is structured, Thai exporters tend to be reliant on demand from a small number of countries that are major consumers, and so in 2022, by value, 53.8% of exports of all Thai rubber products went to China and another 10.6% went to Malaysia. This clustering of demand is especially noticeable in exports of mixed rubber, 99.3% of which went to China, while around a third of the market for TSR exports (32.2%) was also accounted for by China. For concentrated latex, 43.7% of overseas sales were made in Malaysia and another 38.9% were made in China. However, this degree of concentration leaves the industry highly exposed to the risk of changes in the economic outlook in these markets.
In addition, between 2006 and 2012, Chinese investors ploughed funds into developing rubber plantations in the CLMV region, and this is now translating into a steady expansion in supply. The latter thus rose by 13.7% annually over 2018-2022, going from 0.45 million tonnes in 2018 to 0.76 million tonnes in 2022 and as a result, Thailand is losing market share to these countries (Figure 2). Alongside this expansion in supply, China has also increased its output of rubber products, and as the Chinese market has grown, the country’s bargaining position relative to suppliers has strengthened.
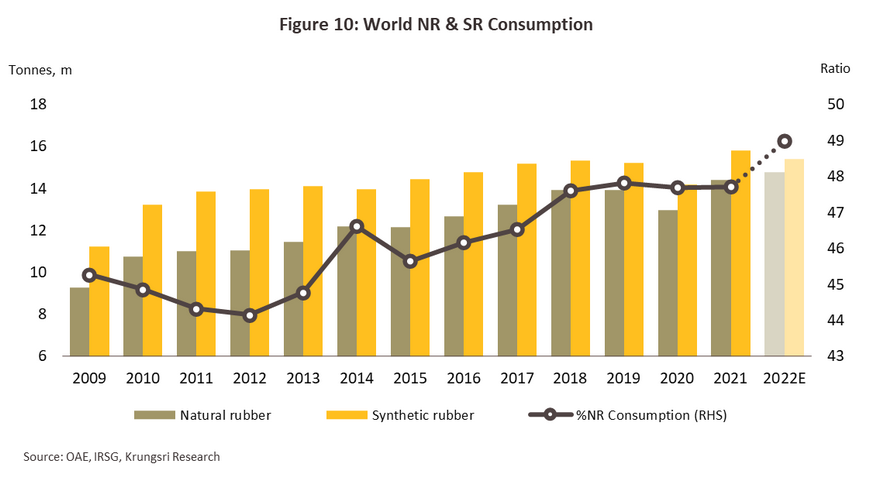
The primary alternative to natural rubber is synthetic rubber, and use of this is thus another growing threat to the Thai intermediate rubber industry. Although it is not possible to substitute synthetic for natural rubber in all applications, synthetic rubber is now used slightly more than natural rubber in many downstream products, especially in the tire industry (in 2022, global inputs were split 49:51 between natural and synthetic rubber) (Figure 10). The growing importance of synthetic rubber stems from the fact that it overcomes many of the weaknesses of its natural counterpart, including greater tolerance of heat, light, oil and chemicals. In addition, because synthetic rubber is an industrial product (it is derived from oil), the manufacturing process is easier to control and the final product displays a much greater uniformity than does natural rubber, which is subject to all the vagaries of biological systems. Using synthetic rubber in industrial applications thus makes it easier for downstream producers to plan and to control quality, though the high cost of oil on global exchanges means that the use of synthetic rubber may carry with it additional overheads.
Situation
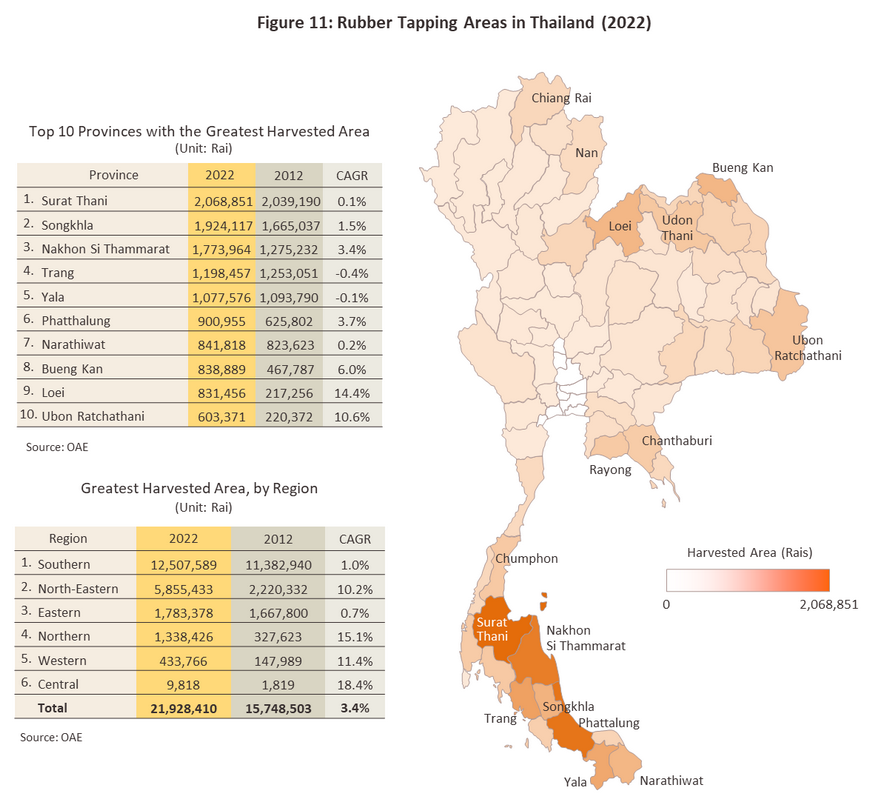
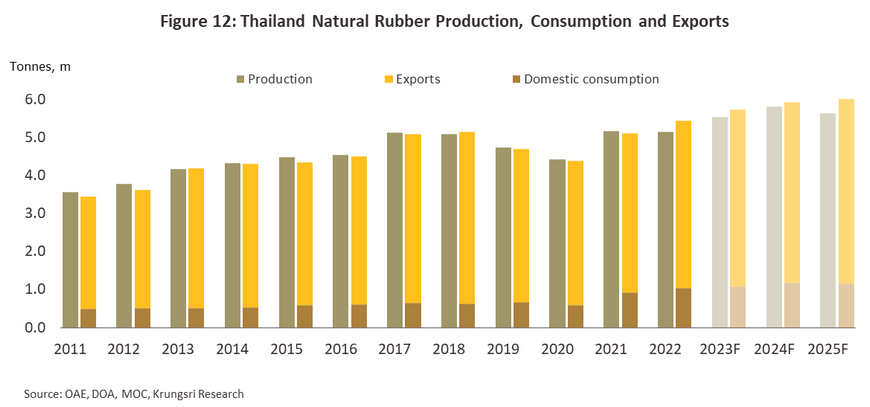
As of 2022, a total of 24.1 million rai was given over to the cultivation of rubber trees, though this represented a decline of -1.5%. 57.6% of this was in the south of Thailand, though as rubber growing has increased in popularity in the northeast of the country (now home to 25.8% of rubber stands), this proportion has fallen, and over the last decade, it has dropped from 63.2% (Figure 11). At present, 21.9 million rai are actively being tapped, and this area outputs a total of 4.8 million tonnes of primary rubber production. Again, these figures have recently declined, dropping by respectively -0.2% and -1.4% as a result of: (i) a decline in the total area under cultivation as growers have felled older unproductive trees and replaced them with alternative crops, such as oil palm and durian; and (ii) lower outputs, most obviously in the south but to a lesser extent also in the central region and in the northeast13/. This decline is a consequence of several factors, including higher rainfall resulting from the recent La Niña that has then reduced the number of days when trees can be tapped and increased losses from excessive rainfall, the spread of leaf drop disease (both older strains and new variants), and higher energy costs that have pushed up the price of fertilizer and reduced applications. The 2022 rubber harvest was then processed into 5.14 million tonnes of midstream products, again down -0.5%, though this is partly due to baseline effects and the rapid growth in output that was recorded in 2021 (Figure 12). This decline was seen in drops in the production of compound rubber (-6.0%) and concentrated latex (-4.6%), while output of other products increased, with sheet rubber up 2.2%, TSR up 4.1%, and ‘other’ products increasing 4.5%.
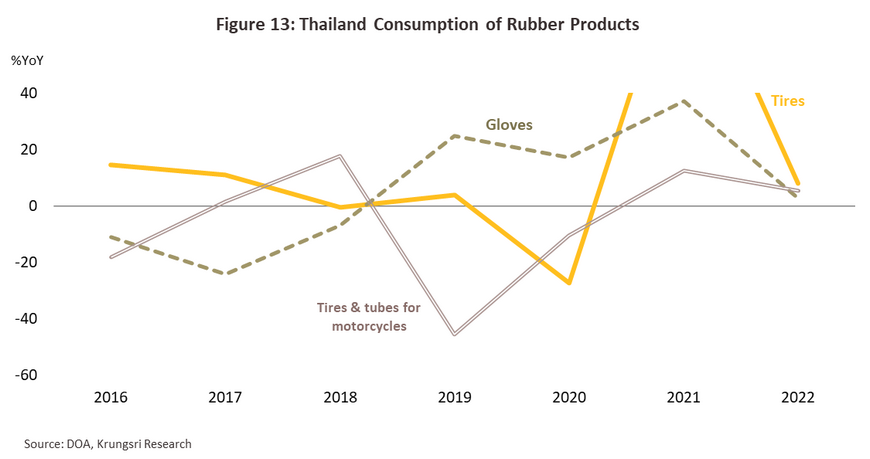
Domestic demand for intermediate rubber products expanded 12.3% to 1.0 million tonnes14/. This growth was driven by improving sales of TSR, which rose 28.2% to 0.39 million tonnes, RSS (+32.8% to 0.13 million tonnes) and ‘other’ types of rubber (+239.7% to 0.09 million tonnes). However, sales of concentrated latex and of compound and mixed rubber fell, dropping -18.2% to 0.22 million tonnes in the former case and -8.0% to 0.21 million tonnes for the latter. Growth came largely from: (i) stronger demand from domestic downstream industrial consumers of rubber, in particular from: (i.i) manufacturers of autos and auto parts, for which sales improved on the need to maintain social distancing measures and this then boosted demand for car tires (+8.1%), motorcycle tires (+5.3%), and car spares (+1,158.0%); and (i.ii) manufacturers of medical devices and supplies, with growth in industrial production capacity being accelerated substantially by the pandemic and the continuing spread of COVID-19, the aging of Thai society, and increased demand for goods related to public health, including latex gloves (+2.7%) and medical supplies (+17.3%) (Figure 13); and (ii) the effects of government policies that aimed to address the domestic oversupply of rubber by encouraging its use in government-backed projects.use in government-backed projects.
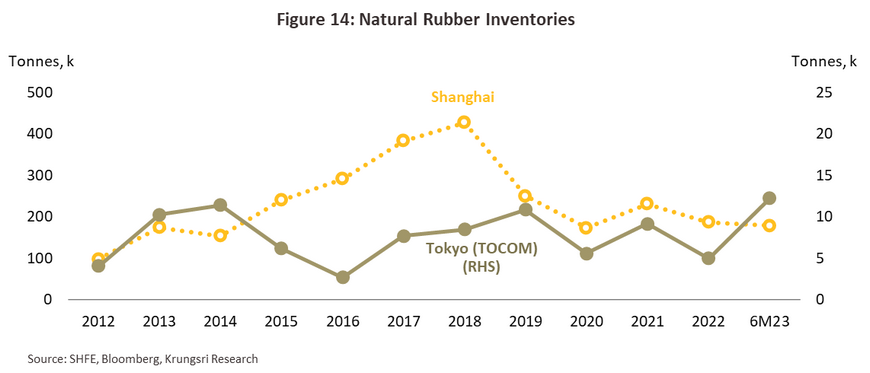
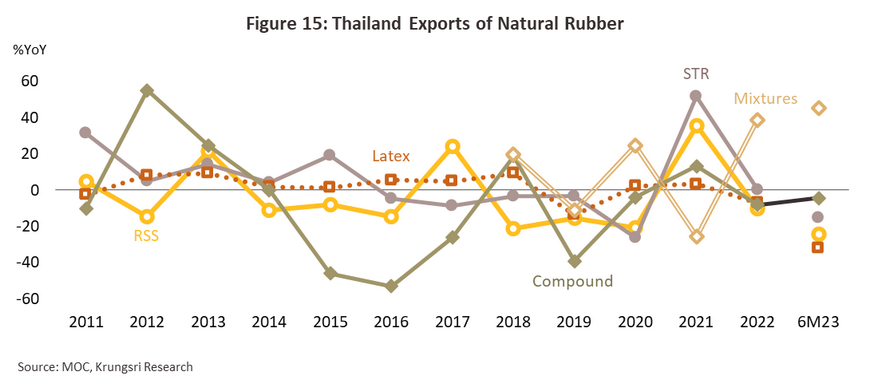
In 2022, exports of intermediate rubber products expanded by 6.5% to 5.0 million tonnes15/, sales of which generated receipts worth USD 8.1 billion (+3.5%). Overall growth was driven by stronger demand for mixed rubber (+38.6%) and TSR (+0.2%), though this was offset by declines in sales of sheet rubber, concentrated latex, and compound rubber of respectively -10.2%, -7.0% and -8.2%. The rise in demand for mixed rubber is explained by the 10.4% expansion in the Chinese market, which went from a total size of 2.4 million to 2.7 million tonnes on growth in the tire and auto (especially EV) industries16/ and which increasingly need rubber inputs with a particular profile. Sales of mixed rubber also benefited from its low price relative to other intermediate rubber products. By contrast, sales of the latter came under pressure from several factors through the year. (i) Demand tended to fall in downstream industries in export markets. Thus, in China, the government’s continuing pursuit of its zero-COVID policy and the resulting strictly enforced lockdowns and quarantines caused labor shortages that then affected output in parts of the economy17/. Likewise, the easing of the pandemic in most countries and the successful rollout of vaccines reduced demand for rubber from manufacturers of latex gloves and other medical equipment, and as a result, exports to Malaysia dropped -15.0% to 0.53 million tonnes. (ii) At the end of 2022, stocks of rubber on the Shanghai and Japanese futures exchanges stood at respectively just 0.19 million tonnes and 5,004 tonnes, down from 0.23 million tonnes and 9,168 tonnes each. This was partly due to stocks having been run down and the fall in new orders in response to slowing output (Figure 14). (iii) Exports to China from Chinese-backed production in the CLMV countries rose by more than 0.76 million tonnes. Total exports thus came to 0.28 million tonnes in Lao PDR (+116.2%), 0.27 million tonnes in Vietnam (+50.0%), and 0.19 million tonnes in Myanmar (+54.0%). In addition to earlier Chinese investment in these countries, exports have also benefited from being cheaper than equivalent Thai production18/. (iv) Other factors that have encouraged buyers to cut back on orders include the slowdown in world trade, the global shortage of containers, widespread delays on shipping routes, elevated freight rates, and the strength of the baht. The situation for 2022 exports of the major product groups is described below (Figure 15 and Figure 16).
-
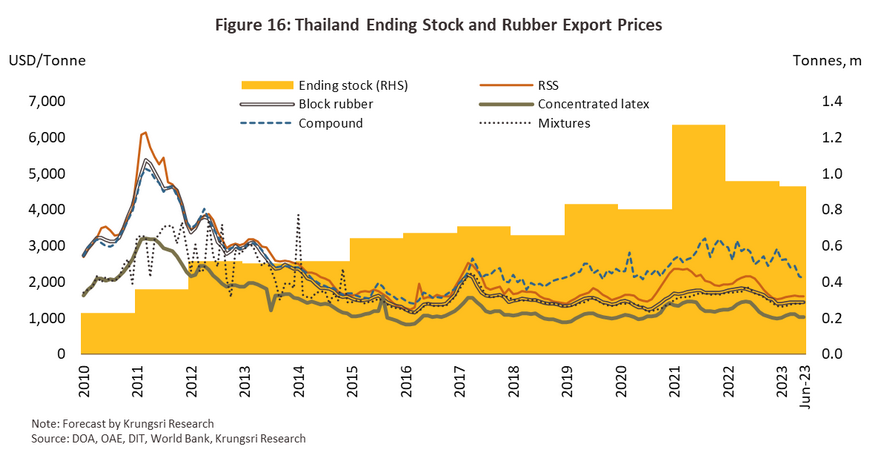
Ribbed smoked sheet: Exports slipped -10.2% to a total of 0.46 million tonnes, which then generated receipts of USD 874.9 million (-20.1%). These declines were driven by the decision by Chinese buyers to sharply increase imports from Thailand’s regional competitors, especially Lao PDR (+150.9%), Myanmar (+81.2%) and Vietnam (+11.3%); Chinese companies have been putting money into developing rubber production in these countries and as such, prices for RSS are lower than in Thailand, resulting in a -28.4% crash in exports to China. Similarly, exports to other markets also slipped, falling -2.0% to Japan, -0.4% to the EU, -7.1% to the US, and -13.1% to Brazil on lower demand from downstream industries and the general slowdown in the world economy. Alongside this, export prices fell back -11.3% to USD 1,915.6/tonne.
-
TSR: Exports totaled 1.66 million tonnes, and although these were up 0.2%, earnings edged down -0.9% to USD 2.83 billion. Exports benefited from stronger demand in secondary markets including the EU (+15.4%), South Korea (+88.9%), the US (+20.3%) and Japan (+27.0%) but these gains were almost entirely erased by the -24.6% crash in exports to the main market of China. Exports of block rubber to China thus fell to 0.54 million tonnes on the switch by downstream industries there to a greater reliance on mixed rubber and the upgrade of standard STR to STR mixed rubber (a type of mixed rubber that comes from the use of TSR in production). This then fed through into a -1.6% softening of TSR export prices, which fell to USD 1,693.6/tonne.
-
Concentrated latex: Exports contracted -7.0% to 1.10 million tonnes, though receipts from this fell at the faster rate of -11.5% to just USD 1.39 billion. Declines were caused by weakness in the main market of Malaysia, where following the easing of the COVID-19 pandemic, demand weakened for rubber products for use in the manufacture of latex gloves and other kinds of medical equipment, pulling down imports by -15.2% to a total of 0.48 million tonnes. This was partly compensated for by strength in markets in China (exports from Thailand rose 8.9% to 0.43 million tonnes) and Vietnam (+8.8% to 0.02 million tonnes). In the year, export prices slipped -6.0% to USD 1,241.7/tonne.
-
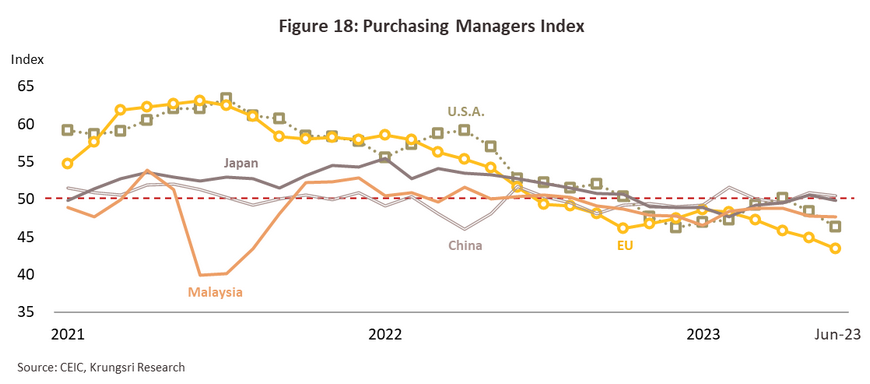
Compound rubber: Exports totaled 0.11 million tonnes, which brought in receipts of USD 306.4 million (declines of respectively -8.2% and -10.3%). Overall sales were undercut by sluggishness in Chinese manufacturing that resulted in particular from the imposition of the zero-COVID policy, and this then triggered a -43.2% crash in exports to the country. Other markets also softened in the year, including the EU (-14.7%) and the US (-6.7%), where, as declines in the Purchasing Managers Index (PMI) indicate, the manufacturing sector was also depressed (Figure 18). As a result of weaker demand, average export prices fell back -3.3% USD 2,764.6/tonne.
-
Mixed rubber: Exports jumped 38.6% to 1.63 million tonnes, while income surged by almost exactly the same proportion (38.7%) to USD 2.65 billion. The market was boosted by the 38.2% increase in sales into the Chinese market, which accounts for a full 99.3% of all Thai exports of mixed rubber. Demand strengthened on growth in downstream industries, the most important of which were the manufacture of tires19/ and of auto parts and spares for ‘new energy vehicles’ (i.e., hybrids and EVs). With demand strong, prices edged up 1.2% to USD 1,647.3/tonne.
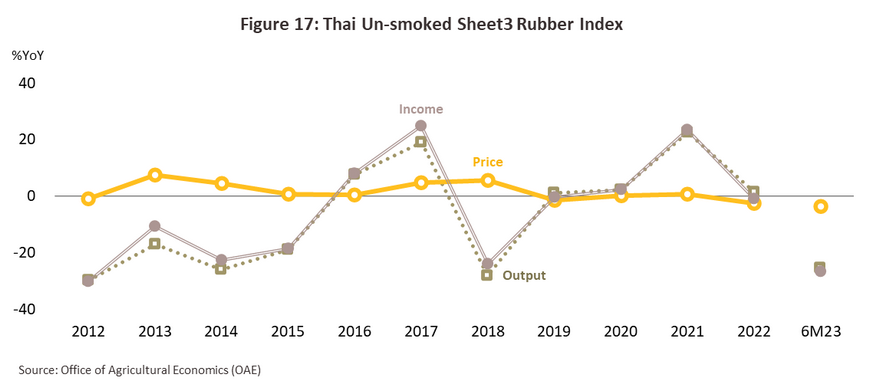
For 6M2023, the upstream rubber industry experienced worsening conditions. This was evidenced by -3.5% YoY contraction in the index of unsmoked sheet 3 rubber output, caused by the higher temperature following the El Niño impacts. Moreover, the falling rubber price dissuaded the farmers from harvesting, on the weakening demand from trading partners especially in Malaysia, the US, and South Korea due to the easing of COVID-19 spread that meant a decline in need for rubber for use in related industries, especially for medical supplies. Beyond this, the cost of crude recorded a downward trend and had an impact on rubber prices. Those factors caused the price of unsmoked sheet 3 rubber to decline by -25.3% YoY and then reduced growers’ income by -26.5% YoY (Figure 17). At the same time, labor and fertilizer costs remain elevated, and this is putting additional downward pressure on growers’ profits.
Over 6M23, total export volume contracted by -2.8% YoY, though by value, exports were down -22.8% YoY to USD 3.3 billion. With a 65.0% share of exports, China remained Thailand’s major overseas market for intermediate rubber goods, followed by Malaysia (7.7%), the US (4.5%), Japan (4.0%), and India (3.0%). Export volumes were down in almost all the major product categories, including sheet rubber (-24.2% YoY to 0.18 million tonnes), TSR (-15.1% YoY to 0.72 million tonnes), concentrated latex (-32.0% YoY to 0.40 million tonnes), and compound rubber (-4.4% YoY to 0.06 million tonnes). By contrast, exports of mixed rubber jumped 45.5% YoY to 1.1 million tonnes. With world trade and the global economy softening, and the Purchasing Managers Index in many countries (including the US, the EU, Japan and Malaysia) weakening from 2022 and slipping below the key 50-point mark and into recessionary territory (Figure 18), demand for rubber in downstream industries contracted. Declines in exports were also spread across most markets, most notably Malaysia (-40.5% YoY), the US (-22.5% YoY), Japan (-20.4% YoY), South Korea (-41.9% YoY), Brazil (-44.0% YoY) and. However, China moved against trend and with the lifting of the country’s zero-COVID policy and the ending of quarantines and lockdowns, industry and most importantly auto manufacturing came back to life. Exports thus jumped 26.5% YoY to 1.6 million tonnes, with sales boosted further by the need to replace stocks that had been depleted at the end of 2022. Exports to India also climbed 7.2% YoY to reach 0.07 million tonnes. The market there was helped by a drop in imports from India’s traditional suppliers in Indonesia and Malaysia, which have been hurt by labor shortages and outbreaks of leaf drop disease.
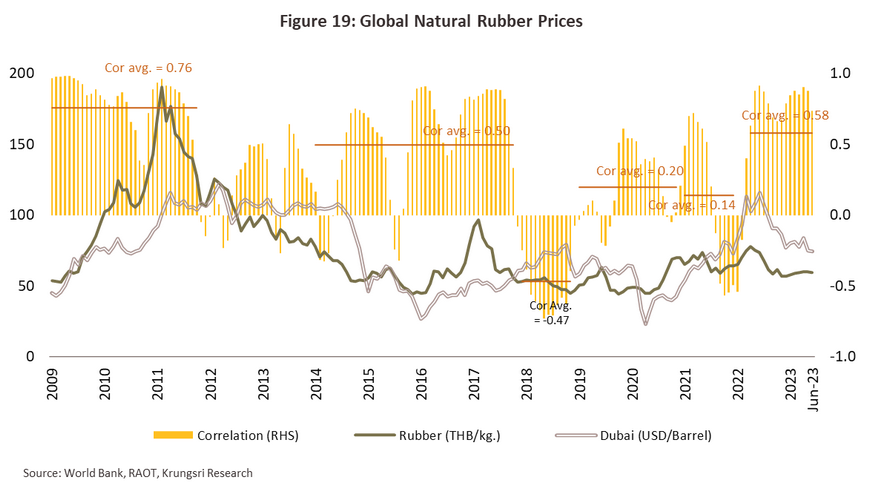
Price movements for rubber are not only affected by basic issues of supply and demand and the level of global stocks held across the industry, they are also increasingly impacted by changes in the price of oil. This is reflected in the correlation coefficient of the prices of Dubai crude and of average monthly prices of natural rubber, which in 2022 rose to a 10-year high of 0.58 (Figure 19). The linkages between crude and natural rubber prices stem from the fact that when prices rise for synthetic rubber, which is made from oil, this encourages manufacturers to switch to natural rubber, pushing up demand for the latter. This then means that prices for natural rubber tend to track those of crude. Over 6M23, crude prices have softened alongside a weaker economic outlook in export markets that has then undercut demand for rubber, and this has then triggered a decline in the price of Thai rubber products. Prices for unsmoked sheet 3 rubber are now THB 44.2/kilogram (-25.3% YoY), and this is reflected in an overall slippage in prices for export goods including RSS (-22.3% YoY to USD 1,603.1/tonne), TSR (-20.5% YoY to USD 1,429.2/tonne), concentrated latex (-23.1% YoY to USD 1,059.2/tonne), compound rubber (-17.2% YoY to USD 2,395.6/tonne) and mixed rubber (-21.9% YoY to USD 1,375.5/tonne). Global prices have likewise softened, with those of STR 20 slipping by an average of -20.2% YoY to USD 1,366.3/tonne, as has the price of crude, which has fallen by an average of -23.3% to USD 78.7/bbl.
Outlook
The Thai rubber industry will enjoy improving business conditions over 2023 to 2025.
-
Output by the Thai rubber industry will move in line with the general trend in growth in the global industry, which is forecast to expand by an average of some 1.5-2.5% annually. Thai production will move somewhat ahead of this, and so growth is expected to average 2.5-3.5% per year20/ on: (i) the expansion in the area under cultivation that took place over 2003-201321/ and the extension of the growing area into the north and northeast in 2015, with plantations in these areas now entering the period of highest outputs22/ ; (ii) the coming El Niño, which is forecast to affect the weather for the next 1-2 years, decreasing rainfall in the south of the country23/ and thus increasing annual outputs by an average of 0.5-1.5% (Figure 20); and (iii) high prices for rubber over 2018-2021 that have incentivized growers to look after their stands and to maximize outputs. Nevertheless, growth will come under threat from the risk of outbreaks of disease, especially of both old and new strains of leaf drop disease24/. In addition, when rubber prices were low, some growers switched to planting more profitable agroforestry products (e.g., durian and oil palm) or raising livestock (e.g., cattle and goats).

-
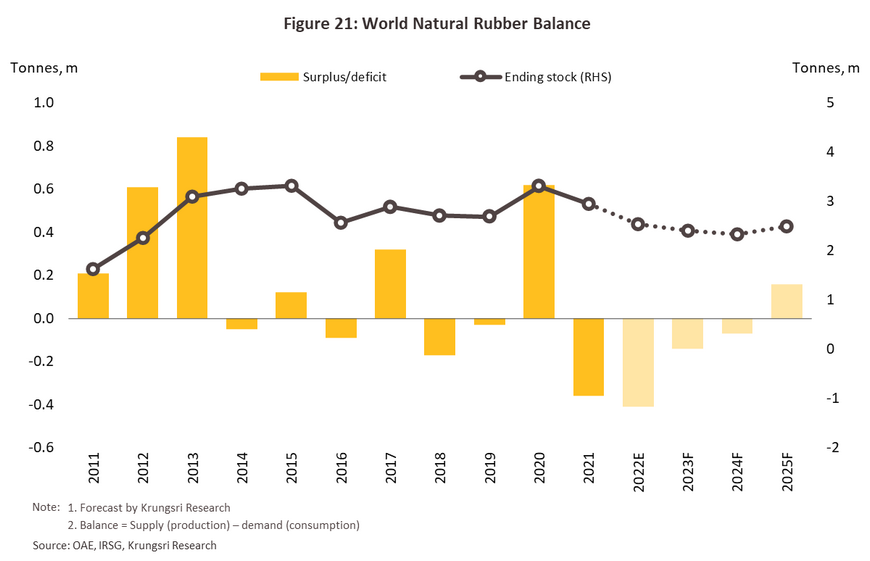
Prices for rubber will tend to soften in the coming period, despite the expected fall in Thai rubber stock holdings to 0.96 million tonnes at the end of 2023, down from 1.3 million tonnes in 2022. The latter will mirror declines in global stocks, which are forecast to contract slightly under pressure from a combination of disease and drought (Figure 21). Domestic prices for unsmoked sheet 3 rubber will thus run to around THB 45-50/kilogram as the market feels the effects of: (i) stiffening competition on price that will come especially from suppliers in neighboring countries; (ii) sluggish conditions in the global economy and continuing pressure from elevated inflation, which Krungsri Research estimates will keep growth in demand for rubber to 1.0-2.0% per year; and (iii) softening crude prices that, although they will remain high, will pull export prices for TSR down from USD 1.7/kilogram in 2022 to around USD 1.4-1.5/kilogram over 2023-2025 (Global prices for TSR20 will likewise contract from USD 1.54/kilogram in 2022 to an expected USD 1.4-1.5/kilogram in 2023-2024, source: World Bank).
\
- The volume of goods distributed domestically should increase by 3.0-4.0% annually (Figure 22) thanks to a range of tailwinds. (i) Demand from downstream industrial consumers will strengthen, especially from: (i.i) manufacturers of autos and auto parts (tires, and parts for both ICE-powered vehicles and EVs), which will benefit from an anticipated increase in output (Krungsri Research sees this rising by 3.0-4.0% per year over 2023-2025 to reach 1.93-2.10 million vehicles) and government support for the domestic production of EVs to substitute for imports25/ ; and (i.ii) manufacturers of medical devices, for which demand should be lifted by the ‘new normal’ of greater care over public health measures and the transition of Thailand to an aging society. (ii) Research and development will lead to the use of rubber in new higher value-added products in farming, auto assembly, chemicals production, construction, packaging and beauty products. (iii) Work on government-backed infrastructure projects should accelerate, especially for those covered by phase 2 of the plan for the EEC development (for the years 2023-2027), and this will support additional demand for rubber. (iv) The industry will be further helped by government efforts to absorb the excess domestic supply of rubber and through this, maintain market stability and prices. These measures include programs to extend credit to rubber processors, increase purchases of rubber by government offices, provide loans for working capital to producers of dried rubber goods, and support growth in domestic industries that use rubber as an input. (v) Given the extended Russia-Ukraine war and the continuing effects of this on oil prices, downstream consumers will tend to increase their use of natural rubber in place of synthetic products26/.

-
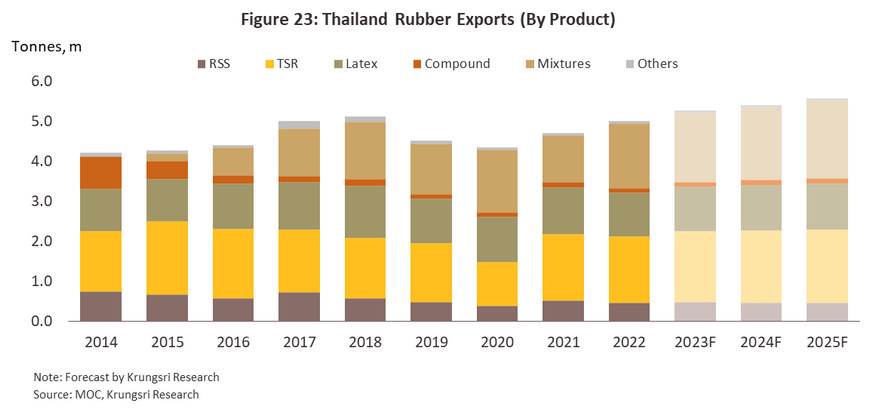
Exports are predicted to expand by 3.5-4.5% annually, outpacing forecast growth in global demand for intermediate rubber goods of 1.0-2.0% per year. (i) Output from industrial users of rubber will strengthen, especially from auto assemblers and manufacturers of auto parts (for ICE-powered vehicles and EVs) in China, the US, Japan and Europe. Auto sales will be boosted by new laws requiring the more frequent replacement of tires, growth in new towns and cities that will add to travel times, and support for the purchase and use of EVs. (ii) Demand is increasing for medical devices, especially for latex gloves and other rubber medical supplies, for use in the treatment of the elderly. (iii) Problems with labor shortages, changes to weather patterns, and outbreaks of leaf drop disease will tighten supply from competitors, especially in Indonesia, Malaysia, and the Philippines, where many growers have switched to planting oil palm and durian in place of rubber. (iv) The continuation of the Russia-Ukraine war will keep oil prices elevated, and with this, prices for synthetic rubber will also stay high. Manufacturers will thus tend to increase purchases of natural alternatives. (v) The emerging El Niño will tend to affect Chinese supply chains, and this will encourage companies to increase stockholdings. The outlook for exporters in individual product segments is described below (Figure 23).
-
Ribbed smoked sheet: Exports are forecast to expand by no more than 1.0% per year. Although sales have been helped by the high quality and widespread recognition of Thai RSS, the effect of broader economic recovery on demand from downstream industries, and the rebound in the Chinese market following the relaxation of COVID controls, growth rates will be constrained by the erosion of Thailand’s competitive advantages by players in Cambodia, Lao PDR, Myanmar and Vietnam, and this will translate into a steady loss of market share (Figure 24). This will be especially evident in China, while in Japan, Europe and the US, orders will slow as worries persist over the outlook for the manufacturing sector and the economy overall.
-
TSR: Exports should increase by 2.5-3.5% annually with recovery in downstream industries, in particular in the most important areas of auto, auto parts and tire manufacturing. In addition, to meet environmental targets, production and use of EVs is going to increase sharply in many countries, including in Thailand’s main export market of China, and this will then feed substantially stronger demand for TSR for use in the production of tires and EV parts.
-
Concentrated latex: Exports are expected to increase by 0.5-1.5% annually on continuing demand for manufacturers of latex gloves and rubber medical devices. Thailand’s main market for concentrated latex is Malaysia, which is in addition the world’s most important producer of latex gloves. However, the successful global rollout of vaccines and the abating of the pandemic is eroding demand for concentrated latex for use in the production of these downstream goods. In addition, trade barriers and blocks on imports are also disrupting the market, for example in the US, where to protect consumers against latex allergies, some states have prohibited the use of gloves made from natural rubber in the food and healthcare industries27/.
-
Compound rubber: This segment can look forward to annual export growth of 2.5-3.5%. Sales will be boosted by stronger demand in the principal markets of India, the US, China and Europe, though with tight monetary policy, improvements will be only gradual. In addition, growth in exports will be held back by the high price of compound rubber relative to other rubber products.
-
Mixed rubber: Sales into export markets are forecast to grow by around 6.0-7.0% per year on stronger demand from the auto, auto parts, and tire industries. Because these use a higher proportion of mixed rubber, demand will be particularly strong for tires for use with EVs. In addition, the main production base for these is in China, which is also Thailand’s most important market for mixed rubber exports. This segment also benefits from the fact that the components that are combined with rubber can be altered to produce materials with properties that are suitable for use in a broad range of downstream industries, including the production of household consumer goods, electrical appliances, airplanes and spacecraft, machinery, batteries, chemicals or in the mining, transport, or construction industries. Demand will therefore expand with growth in the Chinese economy and the relaxation of lockdowns and the zero-COVID strategy.

At the same time, the Thai rubber industry will face a number of challenges. (i) Chinese players have increased their investments in rubber plantations in the CLMV nations and production from these is now a growing presence in the market. This is then raising the risk that exports to China, which had been Thailand’s most important market, may decline. (ii) The Chinese rubber industry is modernizing, and as better exploitation of technology allows production efficiencies to improve, China’s reliance on imports from Thailand may lessen. (iii) The imposition of non-tariff barriers to trade may disrupt export markets, especially measures originating in importing countries that aim to increase the sustainability of the industry and to improve compliance with the laws of the importing nation and with international environmental standards (e.g., the FSC and the EU Regulation on Deforestation-Free Products)28/. Exports will also be affected by the enforcement of measures to encourage the production and use of sustainable downstream products. This will include using products made from recycled inputs and acting to reduce carbon emissions across the supply chain, but meeting these goals will result in higher costs for manufacturers29/. (iv) Outbreaks of disease, especially of leaf drop disease (both older and new variants) continue to trouble growers. Because it is more humid, this is a particular problem in the south of Thailand and outputs consequently suffer to a greater extent. (v) Uncertainty over the global outlook will drag on both domestic and international markets. (vi) Although production costs (e.g., for fertilizer, chemicals30/ and energy) are coming down with the fall in prices for oil, they remain high relative to their pre-COVID level.
1/ The difference between compound and mixed rubber is described on page 10-11 below.
2/ Crepe rubber is made by cleaning cup lump and rubber scraps and then rolling this into sheets that are dried through exposure to the sun or by using hot-air dryers. This is then generally used to produce brown crepe rubber. This form of processing is mostly practiced in the south of the country, though it is becoming more popular among growers in the north and north-east of Thailand.
3/ Rubber farmers may sell either to middlemen or directly to midstream processors.
4/ Precursors used in the manufacture of synthetic rubber include butadiene, which is produced from oil. Important types of synthetic rubber include styrene butadiene rubber (SBR), butadiene rubber (BR), ethylene propylene-diene rubber (EPDM), nitrile butadiene rubber (NBR), chloroprene rubber (CR), isoprene rubber (IR), isobutylene isoprene rubber (IIR), and styrene block copolymer (SBC).
5/ This includes sheet rubber, block rubber or TSR, concentrated latex, compound rubber and mixed rubber, and is calculated from the value of domestic consumption and of exports.
6/ Source: Rubber Research Institute, Department of Agriculture, and research comparing the rubber supply chains of Thailand with those of Malaysia and Indonesia.
7/ Cup lump is formed when field latex coagulates in the tapping cup, and so this takes on the same shape as the container, or cup. The initial product that is collected is white, but over a period of days, the rubber darkens and dries out. Cup lump is regarded as an upstream product, and this is used in the production of TSR. High quality cup lump can be used to produce STR 10, and because better quality inputs are cleaner, they require less processing, which then lowers costs and reduces water consumption. Mixing cup lump with rubber scraps to produce TSR results in lower quality products, such as STR 20 (source: The Rubber Authority of Thailand).
8/ Rubber scraps come from: (i) latex that is collected directly from the tapping grooves, (ii) latex that is stuck to the collection cups, (iii) latex that has fallen on the ground, that is left in containers, or that is recovered from waste water, and (iv) latex left behind from processing into raw sheet rubber, sponge rubber, ribbed smoked sheet, concentrated latex, TSR, or low quality cup lump that contains a large proportion of bark, earth, or leaf fragments or particles. Rubber scraps may be used to manufacture crepe rubber or low quality TSR (source: The Rubber Authority of Thailand).
9/ The standards for Thai TSR produced from field latex are: (i) STR XL, which contains no more than 0.02% impurities and has a color of not more than 4 degrees Lovibond; (ii) STR 5L, which contains no more than 0.04% impurities and has a color of not more than 6 degrees Lovibond; and (iii) STR 5, which also contains no more than 0.04% impurities but which may be of any color and so may be used in any high-quality product that is not highly colored.
10/ The standards for Thai TSR that is manufactured from dried rubber specify grades according to the dirt content, the initial plasticity (Po), the plasticity retention index (PRI), the volatile matter content, and the nitrogen content. (i) STR 20 should have a dirt content no greater than 0.16% and Po and PRI values of no more than 30 and 40, respectively. (ii) STR 10 should have a dirt content no higher than 0.08% and Po and PRI values that are no higher than 30 and 50 each. Material graded as STR 10 is thus of higher quality than that marked as STR 20. In addition, there is also STR 10 CV and STR 20 CV, with the CV standing for ‘constant viscosity’. This type of rubber has been modified through the addition of chemicals that control the rubber’s viscosity, thus making it easier and less energy intensive to cut, mix, and heat (source: Rubber Research Institute, Department of Agriculture).
11/ The most important of these chemicals are: (i) vulcanizing agents, chemicals that cause the rubber molecules to adhere together in a ‘vulcanization’ reaction, which makes the rubber more flexible but also more stable at different temperatures; (ii) accelerators, which improve the vulcanization process by speeding this up and ensuring that the bonding reaction occurs evenly throughout the material, thus improving the rubber’s mechanical properties; (iii) fillers, which are added to rubber for a number of reasons, including to further improve its mechanical properties, cut costs, and give the rubber the qualities required for use in particular production processes. Other chemicals that may also be added include plasticizers, anti-degradants, pigments, blowing agents, flame retardants, and desiccants.
12/ The domestic markets in Thailand, Indonesia and Vietnam consume around 15-30% of production (average for 2016-2022) and this then leaves a considerable quantity available for export (source: Trademap, OAE, DOA, Krungsri Research).
13/ In 2022, per unit yields were down -4.0 kg/rai in the south, -1.7 kg/rai in the central region, and -0.8 kg/rai in the northeast. In the north, yields rose 1.6 kg/rai.
14/ This is calculated exclusively from the dry rubber content (DRC) and does not include water or any other chemicals that are mixed with the rubber.
15/ As per confirmed weight at customs check points. Calculated by the DRC, the total weight came to 4.4 million tonnes. For concentrated latex, the DRC averages 60% of the total weight, while for compound and mixed rubber, the DRC is 80%-95% of the total.
16/ China’s total auto output came to 27.0 million vehicles, up 3.4%, of which 7.1 million were so-called ‘new energy vehicles’ (+96.9%) (source: China Association of Automobile Manufacturers, and the Department of International Trade Promotion).
17/ Shanghai was in lockdown between 28 March to 1 June, 2022. The area is a globally important center of semiconductor production, and so the lockdown had impacts on domestic manufacturing industries through 1H22.
18/ Average 2022 prices for RSS were USD 1,415/tonne in Lao PDR, USD 1,456/tonne in Myanmar, and USD 1,721/tonne in Vietnam. The gap between these prices and those in Thailand is partly due to the high cost of Thai block and sheet rubber. In particular, prices for chemicals (the ammonia and acids used in the production process) have risen with the result that in Thailand, production costs for RSS have almost doubled from THB 4.1/kilogram to THB 7.8-8.0/kilogram (source: Trademap, Small Rubber Tapper and Farmer Association of Thailand, calculated by Krungsri Research).
19/ In China, some 76% of rubber is used in the manufacture of tires. This is followed in importance by latex gloves, pillows, and condoms (12%) and belts, hosing, shoes, shock absorbers, and other products (12%) (source: Xueqiu, DIPT).
20/ On the assumption that rubber trees are not permanently taken out of production and rubber producing countries in Asia do not cooperate to reduce supply to the market.
21/ This is a result of government schemes that ran over 2003-2013 that had the goal of expanding the total area of rubber plantations by 1 million rai.
22/ Typically, rubber trees begin to produce their greatest outputs after 7 years.
23/ Data from NOAA (National Oceanic and Atmospheric Administration) show that the last La Niña was in 2020-2022, and there is a strong possibility that El Niño conditions will emerge in 2023. Krungsri Research sees the effects of the latter lasting for 1-2 years.
24/ Leaf drop disease began to appear in Thailand in 2019, and it has continued to be a problem through to the present day, with both older and new strains now being reported in all rubber cultivars. The current outbreak is driven by the spread of Pestalotiopsis sp. and Colletotrichum sp., which can be transmitted on the wind and in rainwater, or by the movement of infected plants or planting materials. In affected areas, outputs typically drop by 20-50% and growth of affected trees is halted.
25/ Policies to support the EV industry include the zero emission measures to expand domestic production and use of EVs, and the 80% reduction in duty on EVs that was introduced in 2022 (for new EVs registered between 1 October 2022, and 30 September 2025).
26/ The share of total rubber consumption accounted for by synthetic rubber is estimated have risen from 47.7% in 2021 to 49.0% in 2022.
27/ As of June 2023, 8 US states have issued such laws. These have been in effect in the food industry since 1 January 2023, and will be in effect in the healthcare industry from 1 January 2024. The US is the world’s most important importer of gloves manufactured from natural rubber, and is Thailand’s second most important export market for sales of general-purpose and surgical gloves (source: Rubber Authority of Thailand).
28/ This is expected to come into effect in 2024. The EU will then require that importers to the bloc of products in 7 categories that are linked to deforestation (forestry goods, cattle, coco, coffee, oil palm, soy and rubber) make a due diligence statement confirming that the company has put in place appropriate measures and made suitable checks to ensure that the imported goods comply with the laws in the originating country and that their production has not led to or been connected with further deforestation.
29/ The Thai government is attempting to raise the standards of the domestic rubber industry and to put this on a sustainable footing, as per Forest Management Standard 14061. This covers all aspects of rubber farming, from planting, through maintenance, to harvesting and production of goods, as well as the care and enhancement of plantations, as described in the 20-year strategic plan for the rubber industry. To meet standards on global markets and the need to show that rubber and rubber products have been produced in a sustainable fashion, all plantations registered with the Rubber Authority of Thailand (over 20 million rai) will therefore need to comply with Forest Management Standard 14061. These measures will extend to include checking and confirmation of provenance (source: Rubber Authority of Thailand).
30/ The increased price of the chemicals used in processing field latex/RSS has pushed up production costs. Some growers have responded to this by cutting back on applications on fertilizer, although the effect of this is to reduce the dry rubber content of field latex from 30-35% to 25-29%.